Quality Score is the most-obsessed-over, least-actionable number in Google Ads. Every audit we run, the same conversation happens: a client opens the keyword view, points at the orange “5/10” next to a high-performing keyword, and asks how it can be fixed. The honest answer, the one we’ve been giving with increasing confidence over the last few years, is: if that campaign is bringing in leads, we are not going to fix it. We’re going to leave that 5/10 alone, because the keyword is making them money, and Quality Score is no longer a reliable signal of whether an account is healthy in 2026.
We say that as an agency that has spent the last several years auditing Google Ads accounts across dental, healthcare, e-commerce, and B2B niches. And here’s what we tell every YoYoFuMedia client in their first audit: Quality Score is broken into three components, two of them are essentially noise, and the only one you can actually move with deliberate work is ad relevance. The other two, landing page experience and expected click-through rate, behave less like measurements and more like weather. Sometimes they’re sunny, sometimes they’re not, and obsessing over them costs you more than ignoring them.
This article walks through what we’ve actually seen, why the three Quality Score components diverged in 2026, and the three metrics we’d rather you watch instead, the ones that correlate to revenue.
What Google Ads Quality Score actually is (and what it isn’t)
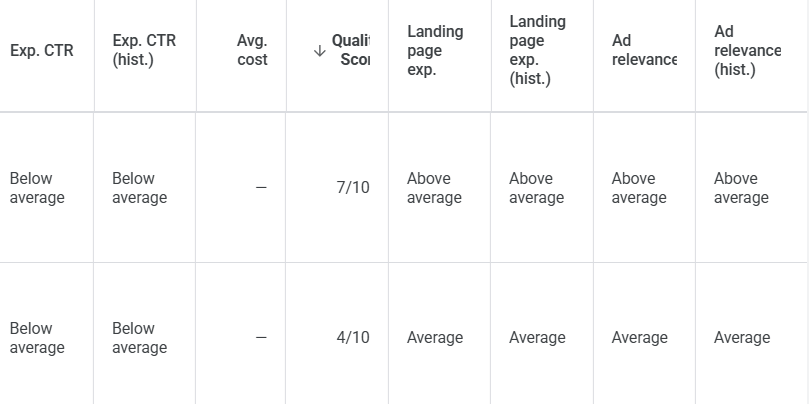
Quality Score is Google’s 1-to-10 score for each of your keywords, calculated from three sub-metrics: expected click-through rate, ad relevance, and landing page experience. Each component is rated as below average, average, or above average, and the composite Quality Score is supposed to predict how likely your ad is to perform well at auction.
In theory, Quality Score determines part of your Ad Rank, Google’s formula for which ad shows where, and at what price. We’ve broken down the math behind Google Ad Rank in detail elsewhere, and the formula is real: a higher Quality Score genuinely does lower your CPC and improve your position.
The problem isn’t the formula. The problem is that the inputs Google reports back to advertisers, the three sub-metrics, have become unreliable to the point where treating them as a management dashboard is actively harmful.
If you want a second opinion on which of your Quality Score numbers are signal and which are noise, our team can walk you through it.
The 3 Quality Score components, ranked by how much you should actually care
1. Ad relevance is the one component you control
Ad relevance measures how closely the words in your ad match the keyword that’s triggering it. This is the component we tell every client to focus on, because it’s the only one of the three where deliberate work produces deliberate results. If your keyword is “implant dentist orange county” and your ad headline is “Family Dental Care Near You,” Google flags ad relevance as below average. That’s fixable in five minutes by writing a tighter ad.
In practice, this means we audit the search-term-to-ad-copy alignment in every account we take over. If the ad group is targeting one intent but the headlines are written for a different one, we don’t try to engineer Quality Score upward. We rewrite the ad to match the keyword. The Quality Score lift is a side effect; the real win is that the ad now speaks to the searcher’s actual query, which is what drives click-through and conversion.
Ad relevance is also the only Quality Score signal that maps cleanly to a useful real-world insight: are the searches we’re paying for actually aligned with the message we’re showing? That question matters whether you care about Quality Score or not.
2. Expected click-through rate is often illogical and not worth managing toward
Expected CTR is Google’s prediction of how often someone will click your ad if it shows for a given keyword, based on historical data across the platform. On paper, this should be predictable: a higher historical CTR equals a better expected CTR. In practice, we’ve watched this number drift in directions that defy reason.
The same exact ad-copy variation will be rated “above average” on one keyword and “below average” on another, in the same account, on the same day. A keyword that pulls a 12% CTR will sometimes show “average” expected CTR while a keyword pulling 4% CTR shows “above average.” We’ve stopped trying to engineer this metric because the cause-and-effect loop doesn’t hold long enough to be useful.
When clients ask us how to improve expected CTR specifically, our honest answer is: write better ads, write tighter ad groups, and use the right match types. Let the metric move on its own as a byproduct. CTR isn’t directly correlated with Google Ads quality score anymore, especially as more ads in the space become placed by PMAX.
3. Landing page experience nowadays is often basically unpredictable
This is the component that frustrates clients the most, because it’s the one they have the most intuitive control over. They’ve built a clean landing page, the page loads fast, the content matches the offer, the CTA is clear, and Google tells them the landing page experience is below average. Why? Don’t ask. We genuinely don’t know, and in a lot of cases neither does Google’s own support team.
We’ve audited accounts where two landing pages with nearly identical copy, layout, and load time get rated differently. We’ve watched a “below average” landing page get rated “above average” the following month with no changes pushed to the page. We’ve also watched the opposite, a meticulously optimized page with strong conversion rates get downgraded to below average for no announced reason.
This doesn’t mean landing pages don’t matter. Landing pages still matter enormously. It will increase your real conversion rate but not the “landing page experience” number that Google gives you. They’re often the single highest-leverage place to spend optimization time, which is why we offer dedicated conversion rate optimization services as a complement to our Google Ads management. We’ve seen a single button A/B test increase a Shopify client’s revenue by 28%, and that was on a page that Google’s landing page experience metric never flagged.
The lesson is that landing-page work should be driven by your own conversion data (bounce rate, scroll depth, form-fill rate, time-to-CTA), not by Google’s opinion of your landing page experience. Google’s metric is an opinion. Your conversion rate is a fact.
The 3 metrics that actually move revenue in 2026
If you stop watching Quality Score, what should you watch instead? We hand every YoYoFuMedia client this short list of three metrics during the first audit, and these are the only three numbers we look at every week when scaling spend.
1. Cost per qualified conversion (not cost per click, not cost per conversion)
The single most useful number in a 2026 Google Ads account is cost per qualified conversion. A “form fill” is not a qualified conversion if half of the form fills are spam. A “phone call” is not a qualified conversion if half of the calls are wrong numbers or under 10 seconds.
Most accounts we audit are tracking cost per conversion, which Google calculates from raw conversion events. That number is almost always better than reality. Once we layer in qualified-lead pass-back from the client’s CRM, the cost per qualified conversion is usually 30-60% higher than the platform-reported number. That’s the number that should drive bidding decisions.
We’ve documented this dynamic in our dental marketing case study and in our SF Bay dental clinic engagement, where we generated 20+ qualified leads in the first month. Both cases where the unlock was tracking the right conversion event with call monitoring/call tracking and tagging calls as qualified vs not qualified. Not optimizing the keyword list. Once you know your true cost per qualified conversion, you can scale spend with confidence. Without it, you’re guessing.
2. Search-term-to-keyword alignment (the metric Google buried)
In 2026 Google has continued to hide search-term data. Fewer reports surface specific queries, and a meaningful chunk of impression volume is lumped into “other search terms” or “low-volume” buckets. Despite that, the search-terms report is still the highest-signal view in the entire platform.
We pull search-term data weekly on every active account and audit two questions: (1) are we paying for searches that actually match the buying intent we’re targeting, and (2) are there long-tail queries converting that we should pull out into their own ad groups for tighter ad relevance? The answers move revenue. Quality Score does not.
Anecdotally, and we’ve seen this pattern repeat across dozens of accounts, most “underperforming” keywords are not underperforming because of Quality Score. They’re underperforming because the search terms triggering them are 2-3 intents away from the keyword’s intended target, and the ad copy is written for the keyword instead of the actual incoming query. Fix the search-term-to-keyword alignment and the keyword starts working again, often without touching bids. We dug into the mechanics of this in our breakdown of Google Ads keyword match types, which is the single biggest lever for controlling search-term alignment.
3. Revenue per click (or revenue per qualified lead)
The third metric, and the one most clients are missing entirely, is revenue per click. Not conversion rate, not CPA, but the actual dollar amount produced per click on average. This number matters because it’s the one that lets you make scaling decisions that are robust to weekly variance.
A campaign with a $4 CPC and a 5% conversion rate looks different from a campaign with a $2 CPC and a 2% conversion rate, but if both produce $8 in revenue per click, they’re equivalent at the unit level. If one produces $12 per click and the other produces $5, the first one should be getting all the budget, even if its Quality Score is half of the second one’s.
We’ve documented exactly this kind of revenue-per-click discipline in our Google Ads case study for an e-commerce client that went from 0 to 3x return on ad spend, where the unlock was passing dynamic conversion values back to Google so the bidder could optimize for revenue, not events. The Quality Scores on that account were, frankly, mediocre. The revenue-per-click was excellent. We grew the account around that.
If you want us to map these three metrics onto your current account and tell you what’s actually driving (or draining) revenue, that’s the first conversation we’d have.
See What's Really Driving Your Revenue
Why 2026 made Quality Score less useful, not more
The gap between Quality Score and account performance has always existed, but it’s gotten wider in 2026 for two specific reasons.
The first is automation. Smart Bidding, Performance Max, and the broader move toward AI-driven bidding have decoupled the per-keyword inputs (which Quality Score is built around) from the actual decisions Google’s algorithm makes at auction. The bidder isn’t really thinking in terms of “this keyword has a 6/10 Quality Score, let me bid 6% lower.” It’s thinking in terms of conversion probability and expected value, and those calculations weight first-party signal (your conversion data) far more heavily than Quality Score.
The second is information asymmetry. Search-term reports are thinner, average position is gone, and impression-share metrics are bucketed in ways that obscure detail. Quality Score is one of the few legacy metrics still surfaced prominently in the UI, which means it gets attention disproportionate to its usefulness. Just because a number is visible doesn’t make it actionable. We talk through some of the actually-useful data Google still gives you in our breakdown of free Google Ads optimization tools provided by Google, and Quality Score isn’t on the list.
The combined effect is that Quality Score has become a vanity metric. It looks like it should mean something. It feels like it should mean something. But the accounts that grow profitably in 2026 are not the accounts with the highest average Quality Scores. They’re the accounts with the cleanest first-party data and the tightest ad-to-search-term alignment.
What we actually do with Quality Score in a YoYoFuMedia audit
Two specific behaviors:
We use Quality Score as a diagnostic flag, not a target. If a keyword has below-average ad relevance, that’s a signal to look at ad copy. If a keyword has below-average expected CTR despite strong actual CTR, we ignore it. If a keyword has below-average landing page experience, we check the page is loading and mobile-friendly, and then we ignore it.
We never pause a profitable keyword because of low Quality Score, and we never scale an unprofitable keyword because of high Quality Score. The keyword’s job is to make money. Quality Score’s job is to give us occasional hints. When the hint is useful, we use it; when it isn’t, we don’t.
This is the same philosophy we apply when we set up keyword bidding in our Google Ads keyword bidding strategy framework: bid on profit signals, not platform metrics.
Frequently asked questions
Does Quality Score still affect my CPC in 2026?
Yes. The underlying Ad Rank formula still uses Quality Score, so a lower Quality Score does correlate with a higher CPC at auction. But the magnitude of the effect is smaller than most advertisers think, and it’s increasingly dwarfed by the impact of Smart Bidding’s conversion-probability calculations. In our audits, the CPC delta between a keyword’s “good” Quality Score and “poor” Quality Score is rarely the make-or-break factor for profitability. It’s usually the difference between a $4.20 CPC and a $4.80 CPC, not the difference between a profitable and unprofitable account.
Should I pause keywords with low Quality Score?
Not if they’re converting. We’ve seen 4/10 Quality Score keywords carry entire accounts, because the search terms triggering them were highly qualified despite Google’s negative opinion of the keyword-ad combination. Pause keywords because of poor cost per qualified conversion, not because of poor Quality Score.
What’s the fastest way to improve ad relevance specifically?
Tighten the ad group. Most accounts we audit have ad groups that contain too many semi-related keywords with one or two ad variations covering all of them. Splitting one bloated ad group into three or four tighter ad groups with ad copy written for each cluster’s specific intent improves ad relevance reliably, in a way that we can predict and replicate.
Is landing page experience worth optimizing for at all?
Optimize landing pages for your conversion rate, not for Google’s landing page experience score. The two correlate weakly. We’ve watched landing pages with strong conversion rates carry below-average landing page experience scores indefinitely, and the campaigns ran fine. We’ve also watched above-average landing page experience scores on pages that converted poorly. Build for your customer; the metric will follow when it follows.
Can a Google Ads agency actually improve Quality Score?
A good agency can improve ad relevance reliably, expected CTR somewhat, and landing page experience marginally. But the framing is wrong. A good agency improves revenue per dollar of spend. Quality Score moves are a side effect, not a deliverable.
What to do next
If your current Google Ads account has below-average Quality Scores on keywords that are profitable, leave them alone. If your current account has above-average Quality Scores on keywords that aren’t profitable, the high Quality Score is misleading you. Those keywords are still bleeding budget. The number isn’t the goal. Profit is the goal.
That’s the foundation we audit every account against in our Google Ads management engagement, and it’s the conversation we’d want to have with you before scaling spend on any account, including yours. If you’d like us to look at your current Quality Score patterns and tell you which of them are signal and which are noise, and which three metrics we’d want to watch on your account specifically, that’s a conversation we’re happy to have.
Bring us your account, and we’ll tell you which Quality Score signals to trust and which to ignore on day one.


