As a vet, your website is the equivalent to the front of your clinic. You want to be able to track how many people come in and out and from where. This helps with your advertising and also lets you know if your social media & other marketing efforts are working.
For example, we often see with our clients that a week or two after they get a spike in traffic on their website, they get a spike in traffic to their clinic. So this means, whenever they see a spike in traffic in their Google Analytics they can expect more appt bookings coming up soon.
In this blog post, we’ll share with you the importance of tracking the traffic of your website and walk you through the steps on how to set up Google Analytics for Veterinarians!
Table of Contents
ToggleWhat is Google Analytics?
Google Analytics is a must-have tool on every website. Its software provides you with useful reports about the performance of your veterinary website which make it easier for you to analyze the results of your marketing efforts.
It also allows you to create customized reports based on your preference. This includes comparing the performance of your marketing campaigns from this month to the previous month, tracking which time and day most users visit your veterinary website, and a lot more! You don’t have to go through the hassle of switching tabs just to see how well your website performed on specific dates.
Why Google Analytics for veterinarians?
It puts your veterinary practice at a competitive advantage
What’s great about Google Analytics is that you don’t have to pay anything to access its features. You can get useful information and statistics that will help optimize the performance of your website for free!
Not just that, but you also get to know more about your page visitors in terms of age, gender, interests, devices used, and user location. Acquiring data in these aspects is beneficial on your end, especially in formulating marketing strategies that suit your target audience and creating personalized marketing campaigns.
The more you get to know about your potential clients, the easier it is for you to provide relevant content to these users.
Provides a better understanding of which platforms to target
There are lots of social media platforms you can use to promote your veterinary services. But, you want to make sure that when launching marketing campaigns, it should be where your target audience is.
With the use of Google Analytics, you’ll be able to track the volume of traffic you get and create segments to individually analyze your page visitors on each platform. You can also see other reports about your page visitors’ behavior by creating filters. This way, you get to see the bigger picture when it comes to analyzing your marketing efforts on social media.
Allows you to track goals
Google Analytics allows you to track whether you are reaching your marketing goals (e.g. the number of lead form submissions on your veterinary website, the average duration of page visits, and monitoring the events on your veterinary website).
In Google Analytics, there are 4 goals that you can measure. This includes Destination, Event, Duration, and Pages per session.
Destination – this tracks the number of people who landed on your thank you page (e.g. after placing an order or submitting a form).
Event – this tracks the interactions (e.g. button clicks, outbound clicks) of your page visitors on your veterinary website.
Duration – this tells you how long page visitors stay on your veterinary website.
Pages per session – this tracks the number of pages viewed by each user on your site.
Easy integration with other tools
Aside from tracking the performance of your veterinary website, Google Analytics also allows you to integrate Google Services like Google Ads, Google Search Console, and Ad Sense. Which makes it easier for you to analyze data across these platforms in one place.
For example, if you already have an ongoing ad campaign using Google Ads, linking it to your Google Analytics account will make it easier for you to conduct a thorough performance analysis.
Interested in other tools that can help you in marketing your veterinary practice? Check out our blog post on Digital Marketing for Veterinarians to learn more.
Want to start tracking the performance of your veterinary website but don’t have time to manage it?
How to Setup Google Analytics for Your Veterinary Website
Now that you have an idea of why Google Analytics is essential to your veterinary website, we’ll walk you through the steps in creating your account.
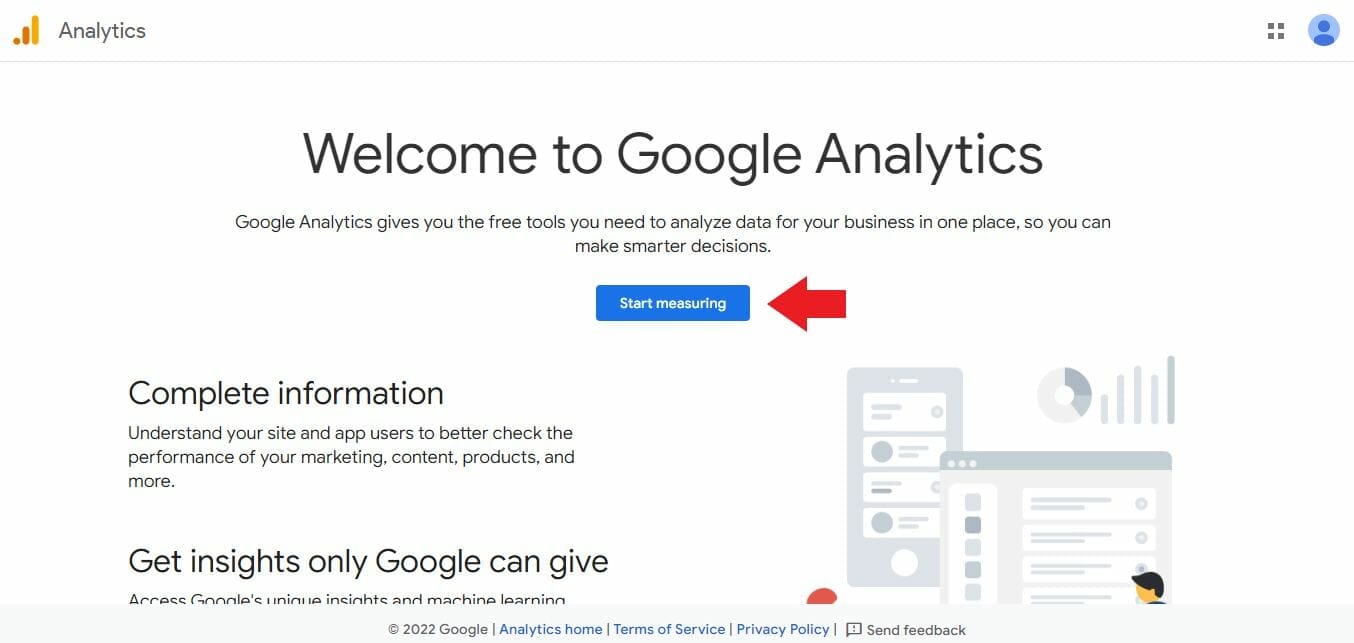
Go to the Google Analytics homepage and create your account by clicking the button that says “Start Measuring.”
Enter the name of your veterinary clinic in the “Account name”.

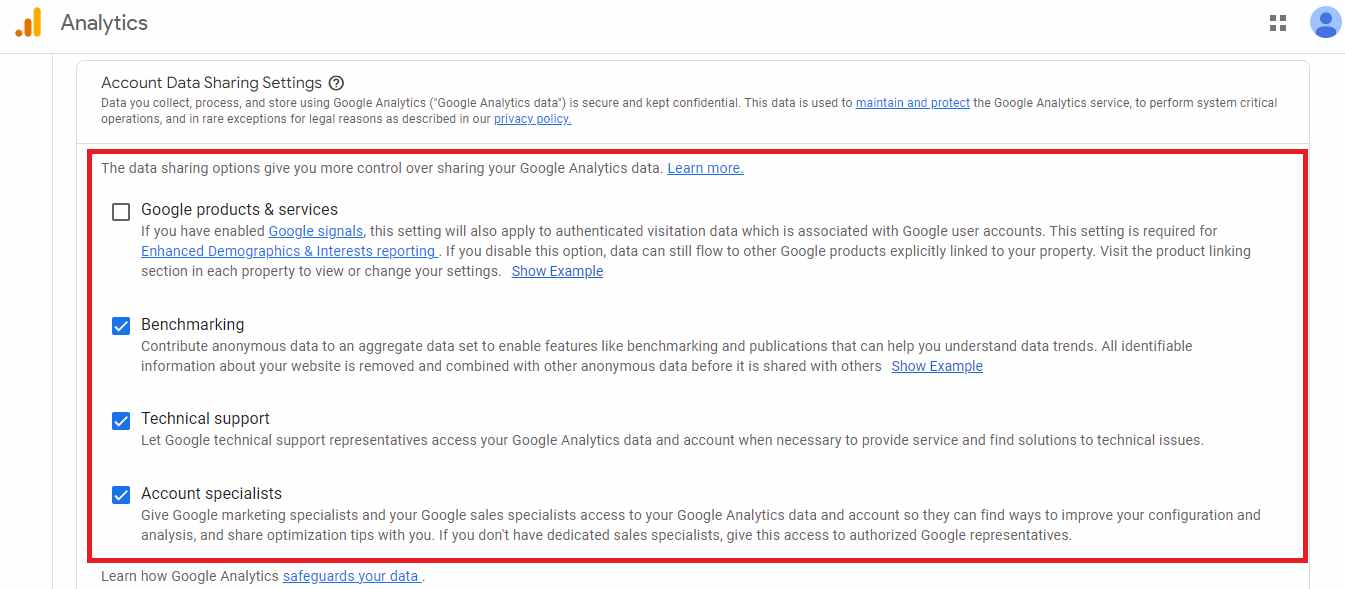
Then, under Account Data Sharing Settings, check the sharing options based on your preference.
For example, clicking the box for “benchmarking” allows you to compare the performance of your veterinary website to other websites in the same industry
After that, click “next.”
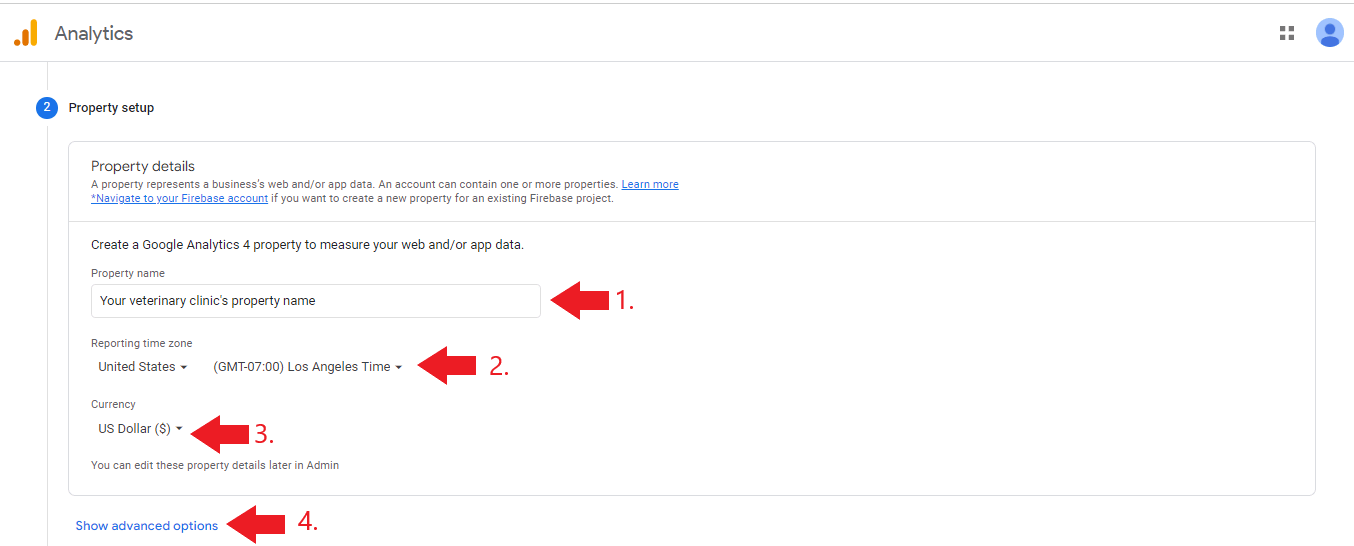
The next step is setting up your veterinary clinic’s property.
Enter your property name, the reporting timezone, and the currency. It’s important to provide correct details in this section because these are important factors when it comes to tracking user data such as your veterinary clinic’s revenue and conversions.
Then, click “show advanced options.”
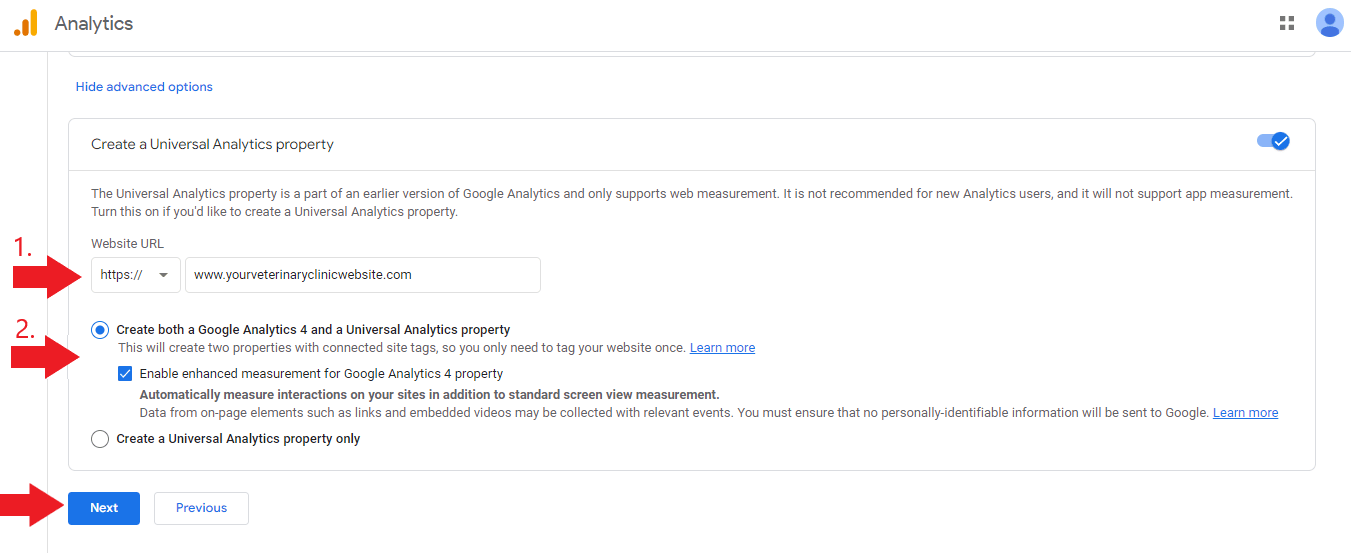
Toggle the switch that says “Universal Analytics property.”
Next, enter the URL of your veterinary website.
Once you’re done, click the circle that says “Create both a Google Analytics 4 and Universal Analytics property.”
After that, check the box that says “enable enhanced measurement for Google Analytics 4 property”
Then, click “next”
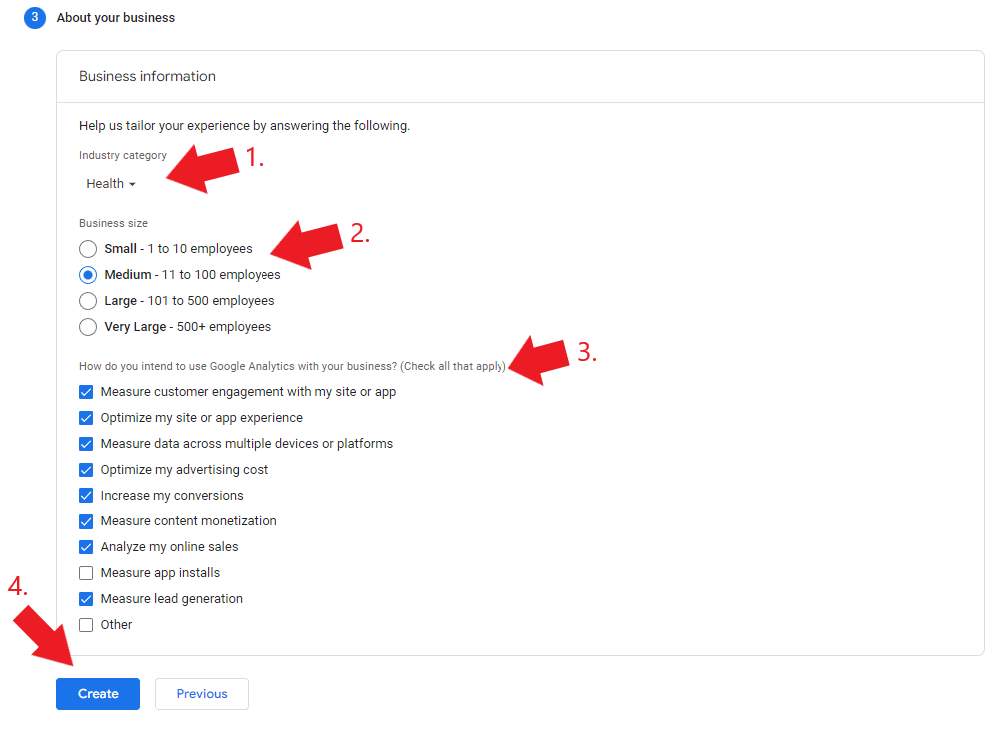
In the next section, you’ll be entering more information about your veterinary clinic.
For the Industry choose “Health.”
Then, select your business size followed by choosing the options of how you intend to use Google Analytics for your veterinary clinic.
Once done, click “create.”
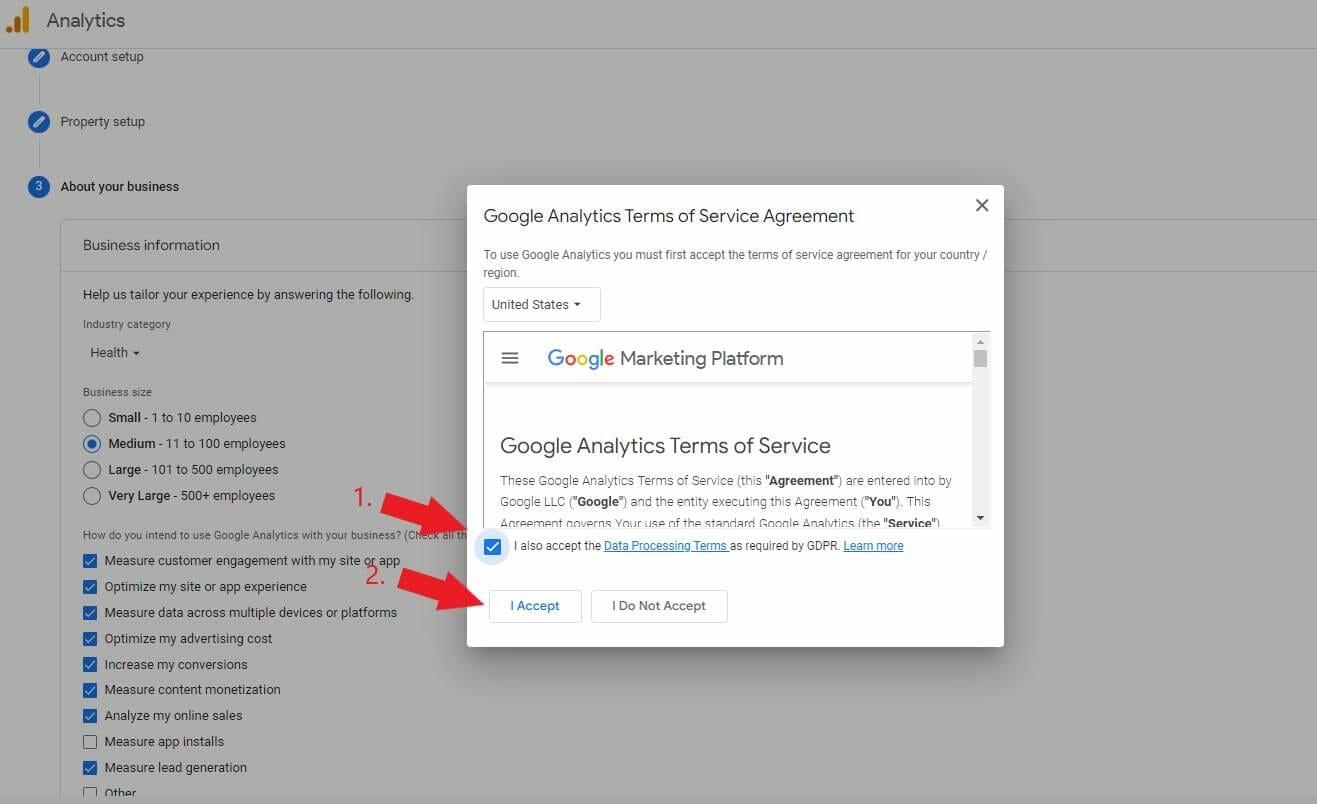
Check the box that says “I also accept the Data Processing Terms as required by GDPR” then click the “I accept” button.
A pop-up will appear asking you if you want to receive email notifications for performance suggestions, updates, announcements, etc. Choose what you want to receive from Google Analytics, and click “Save.”

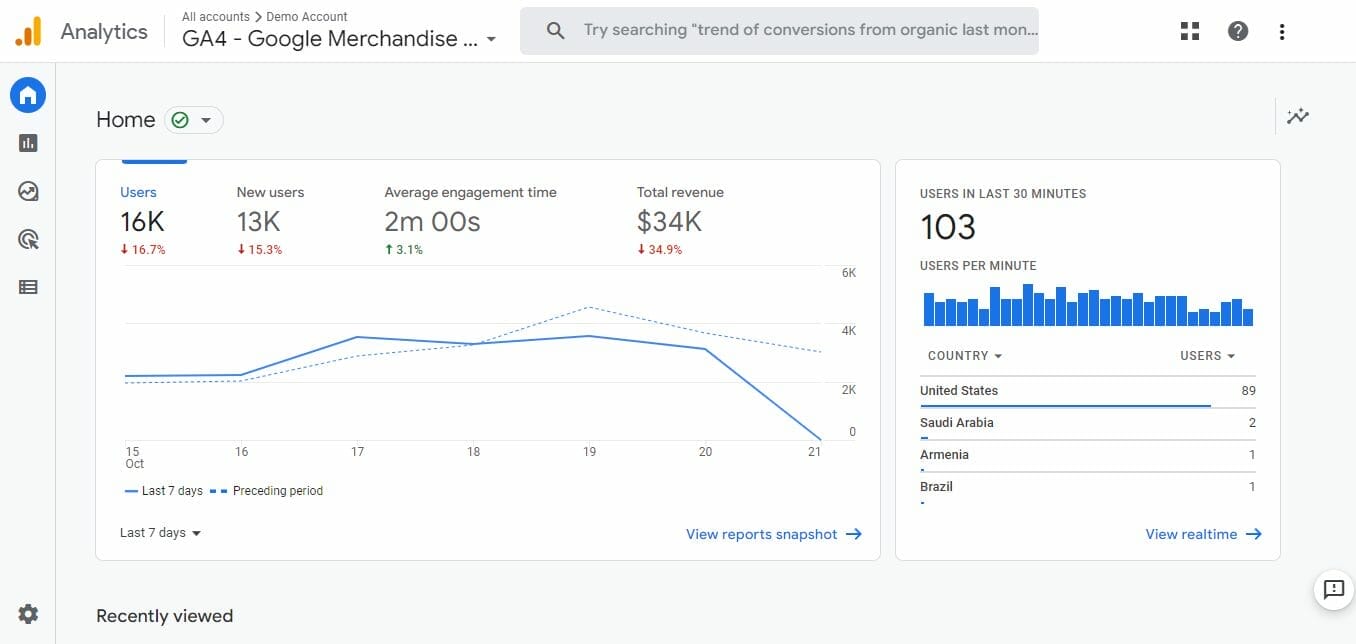
Here’s what your veterinary website’s GA dashboard is supposed to look like once it starts gathering relevant data from your page visitors
Need help setting up your veterinary clinic’s Google Analytics account?
How to go from Universal Analytics to GA4
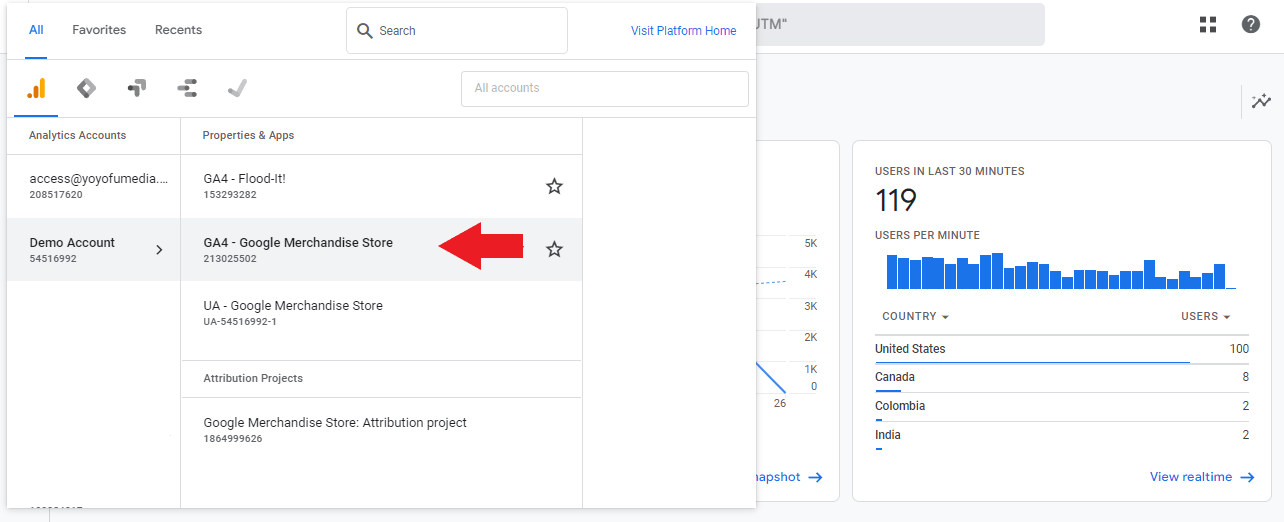
Step 1: Beside the Google Analytics logo, click UA – the name of your property (veterinary clinic)

Step 2: Under properties & Apps, click GA4 – the name of your property (veterinary clinic)
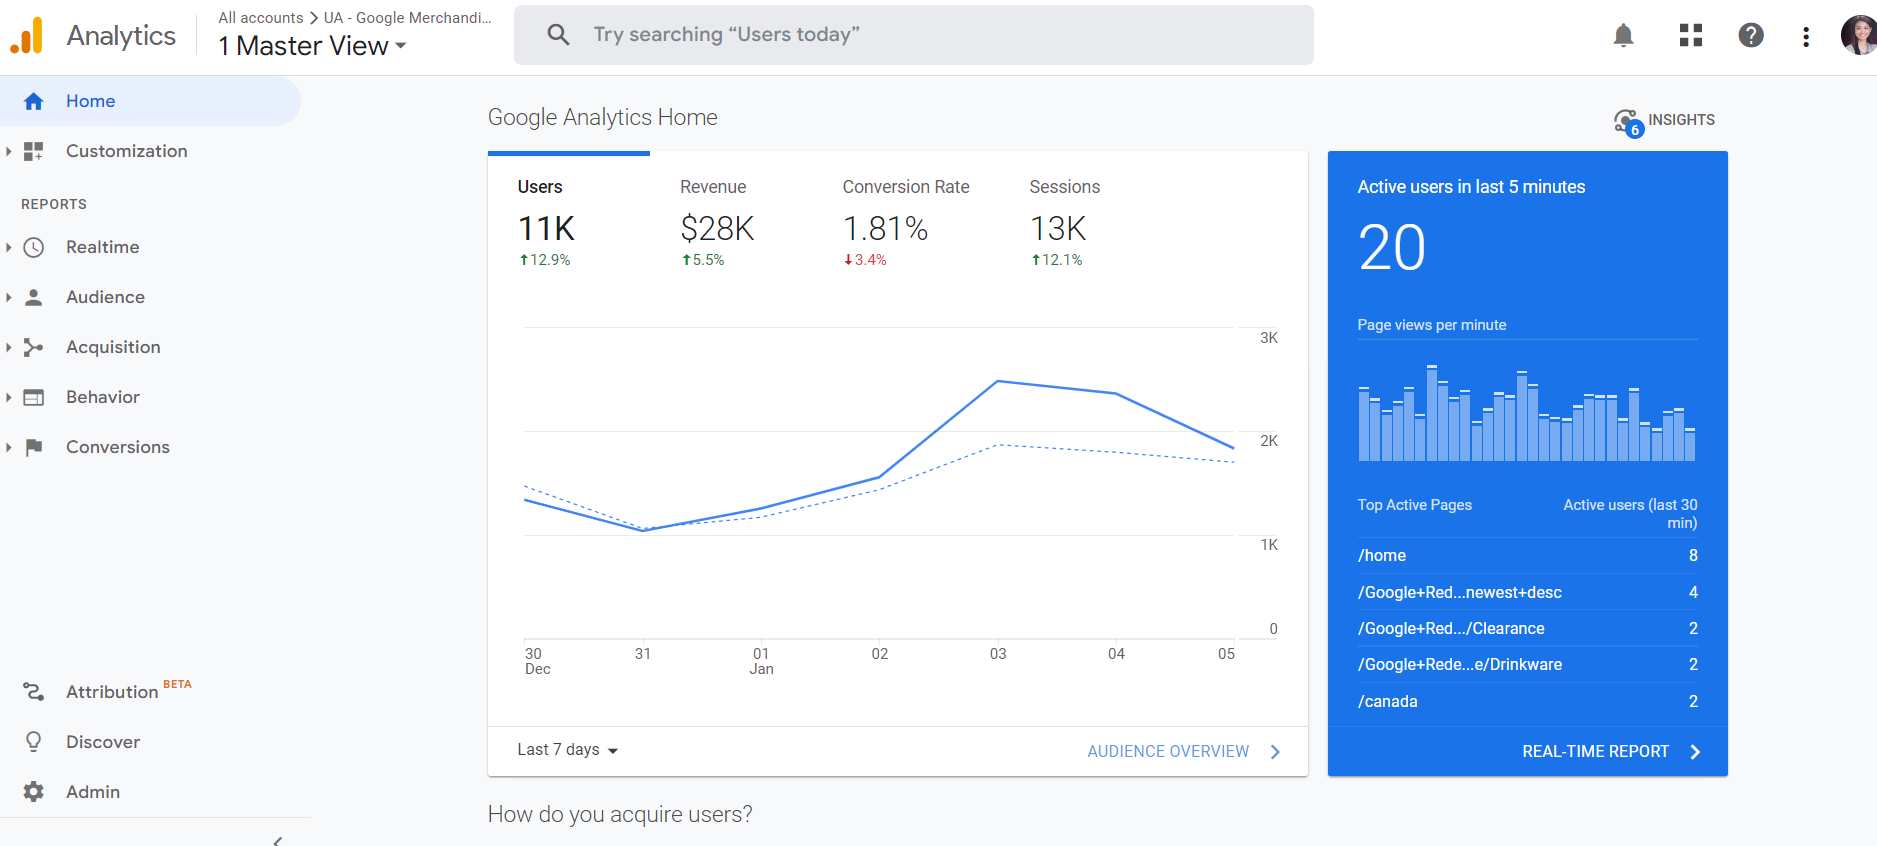
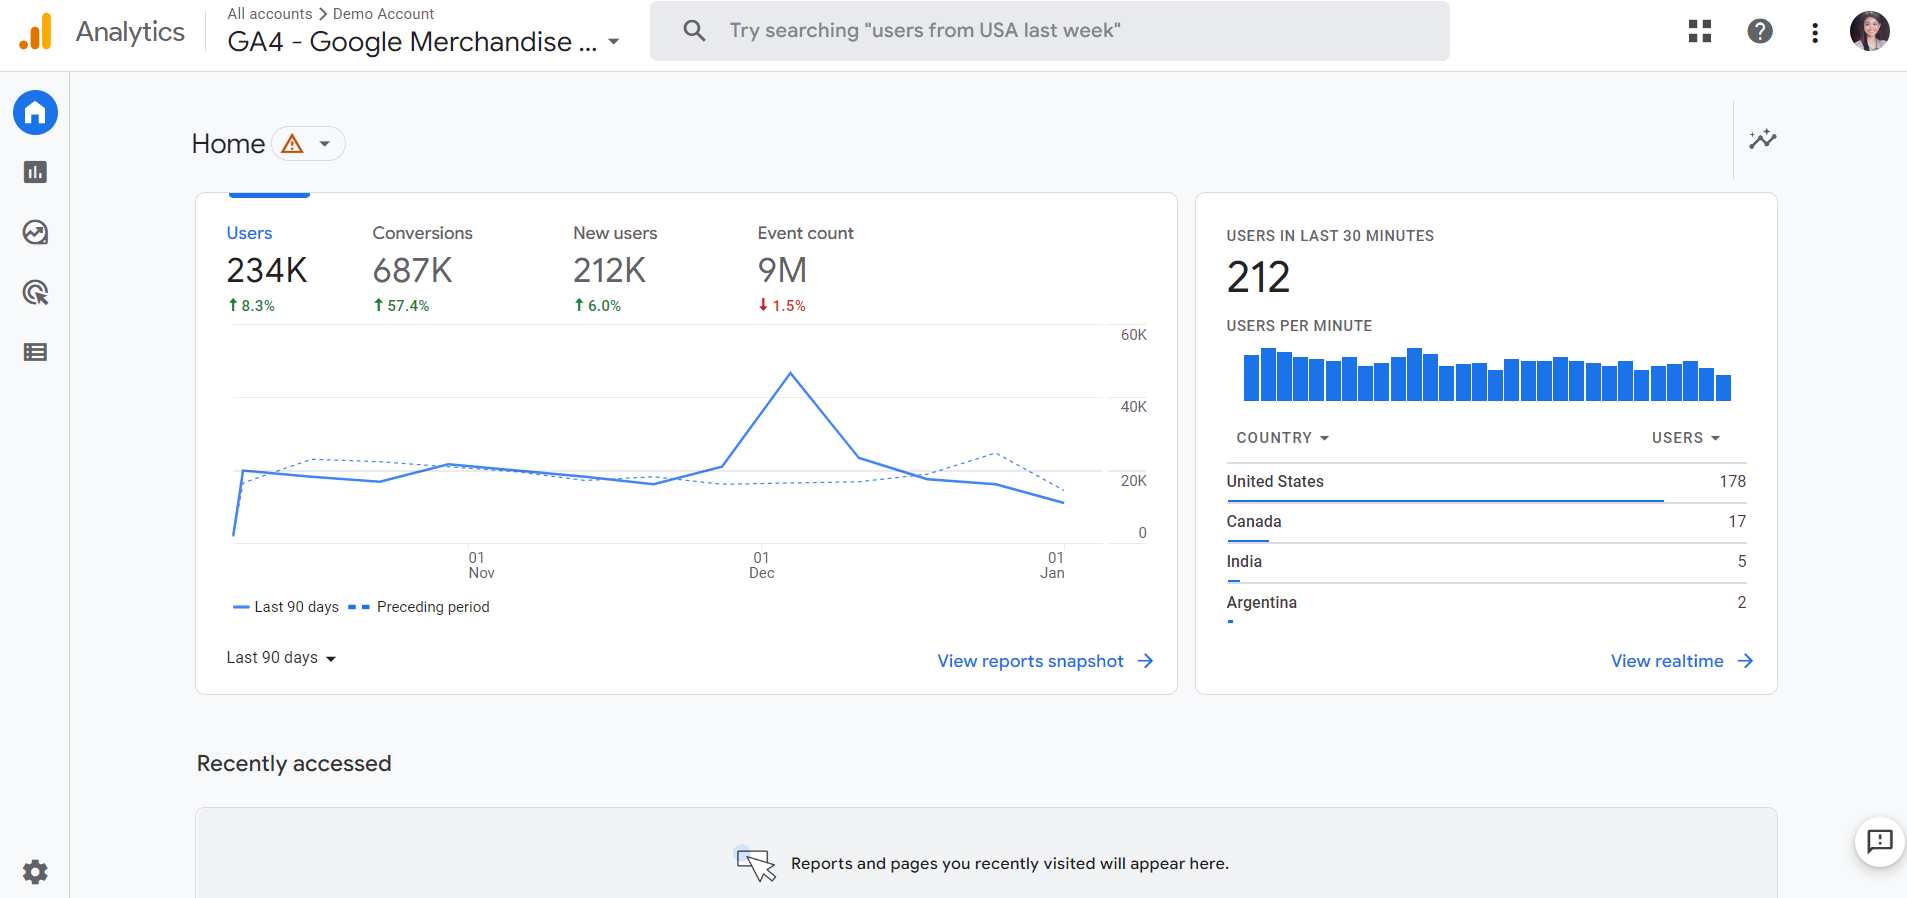
This is how your dashboard will look like in Universal Analytics:
and in Google Analytics 4 (GA4):
How to manually install your Google Tag
In this section, we’ll walk you through the steps on how to install your Google Tag manually on your vet clinic’s website. It’s important that you install this after setting up your GA4 property because, without it, you won’t be able to track the performance of your veterinary website.
Here are the steps on how to do it:
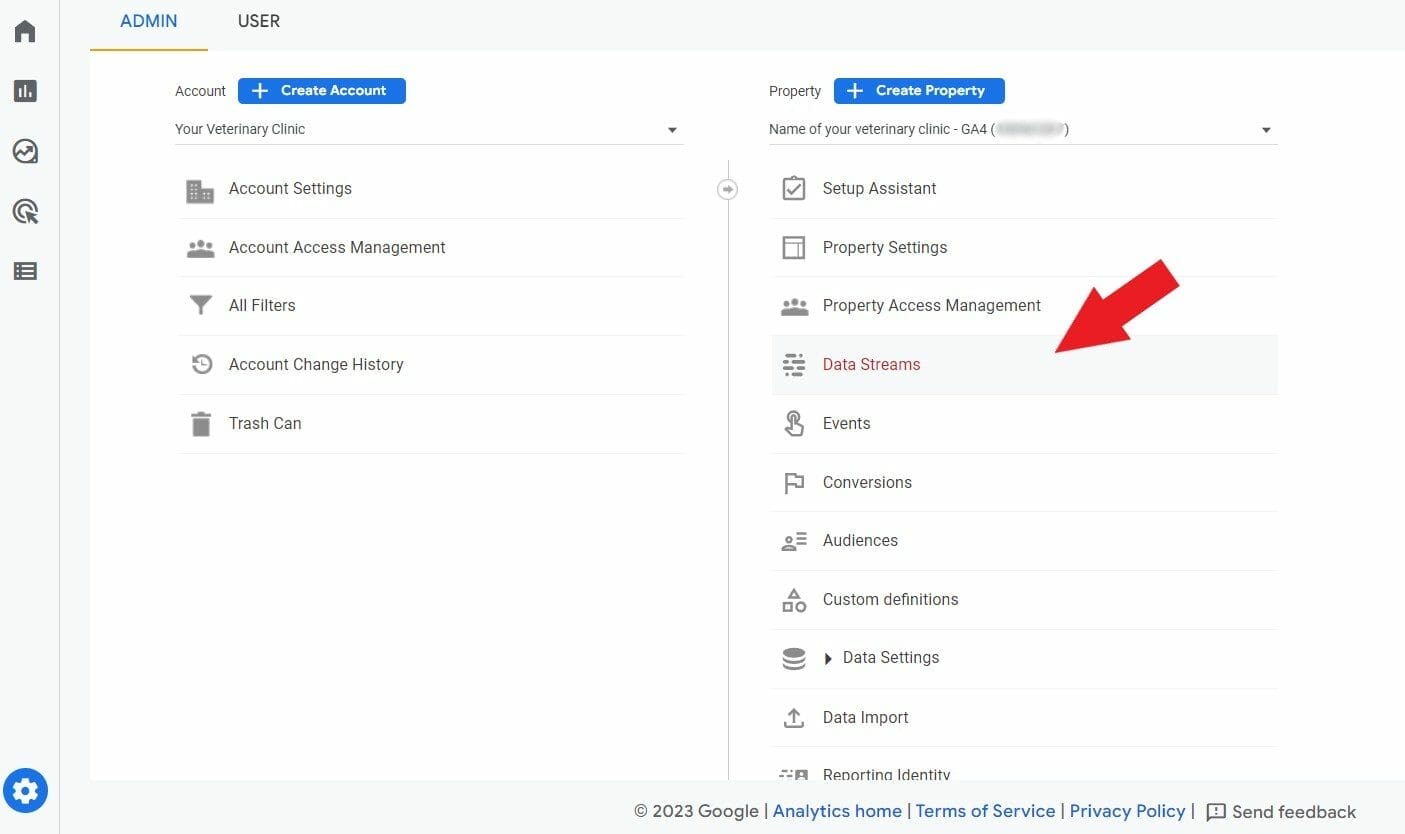
On your Google Analytics dashboard, click “admin.”

Hover over the Property column. Then, click “Data Streams.”
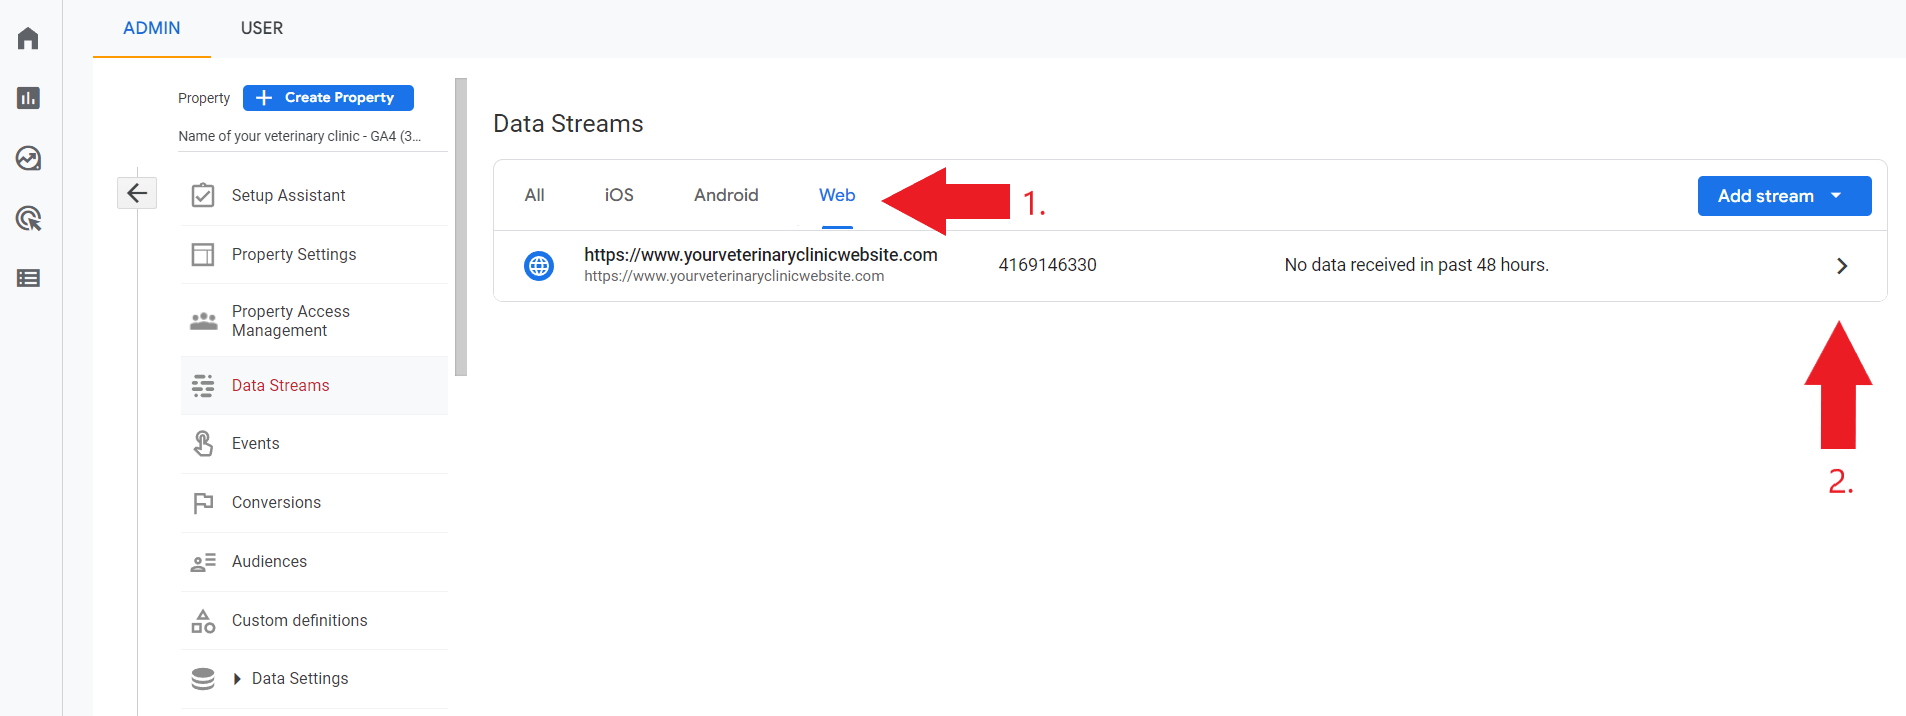
After that, select “web” followed by the arrow button.
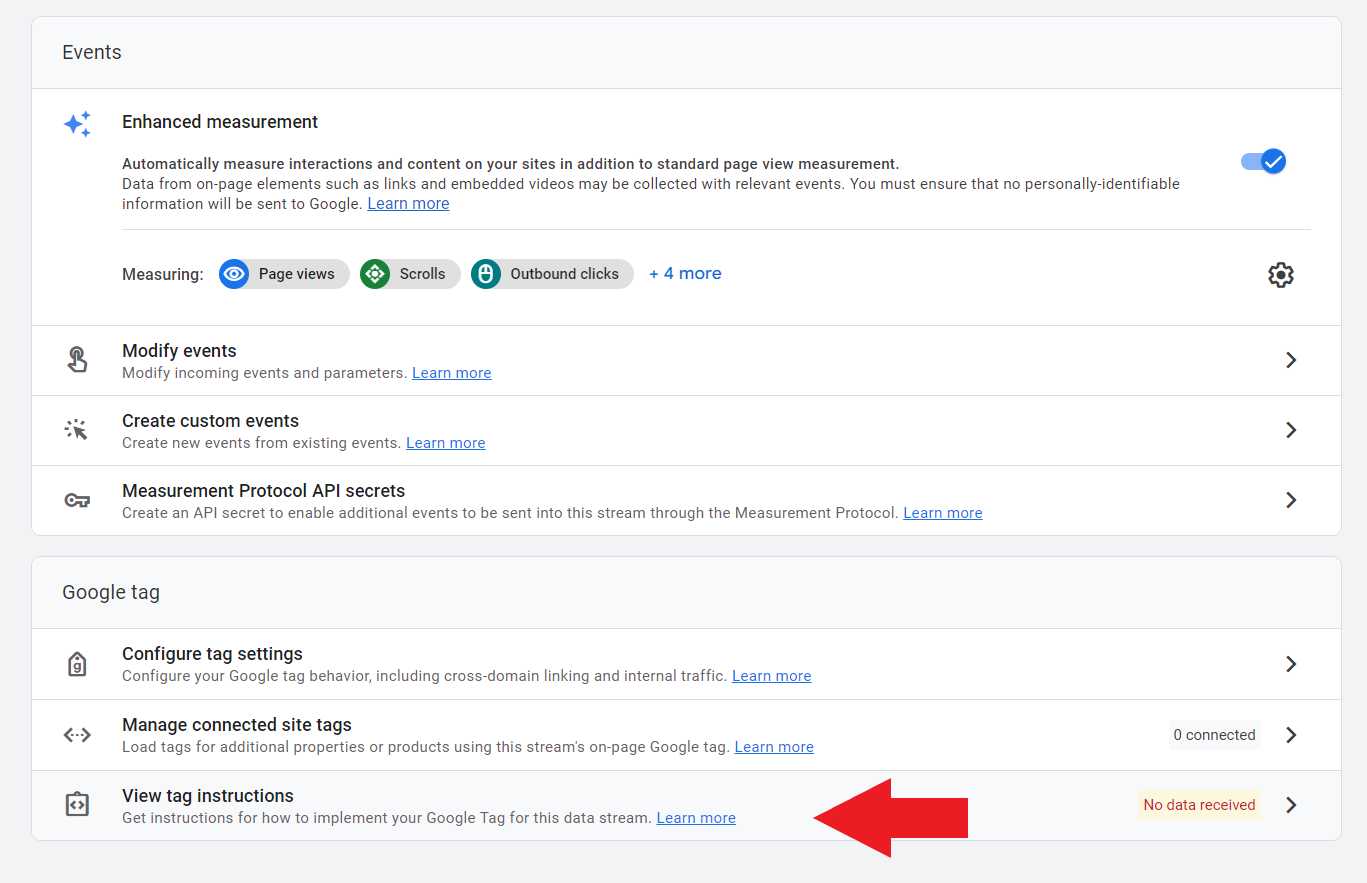
You will see your veterinary clinic’s Web Stream details. Go to the Google Tag Section and click “View tag instructions.”
Click “install manually” and copy your Google Tag code.
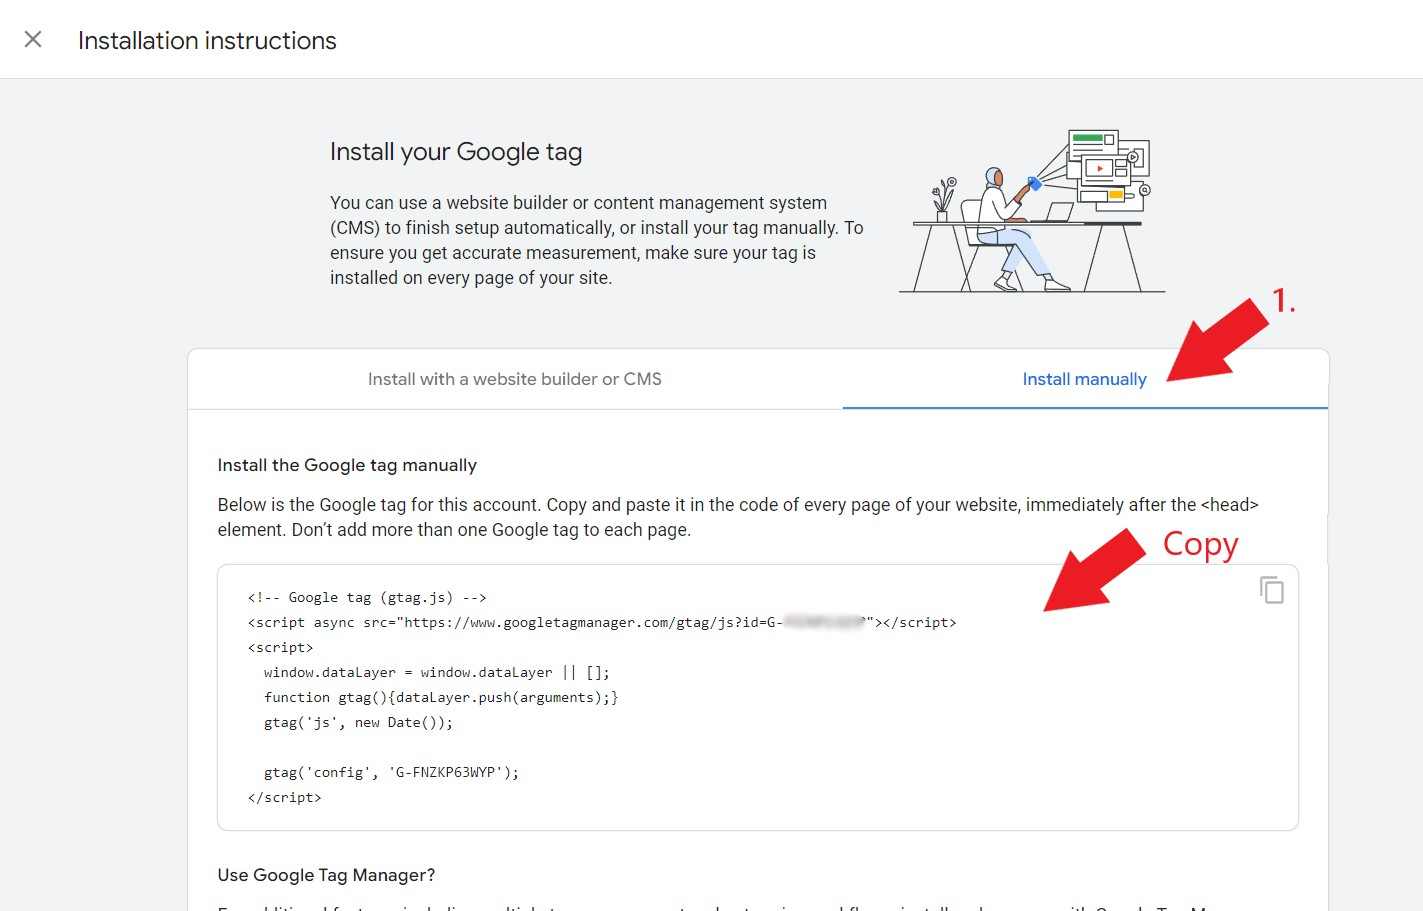
If you are using WordPress on your vet website, here are the steps on how to install the tag:
Scroll down to “Code Snippets” 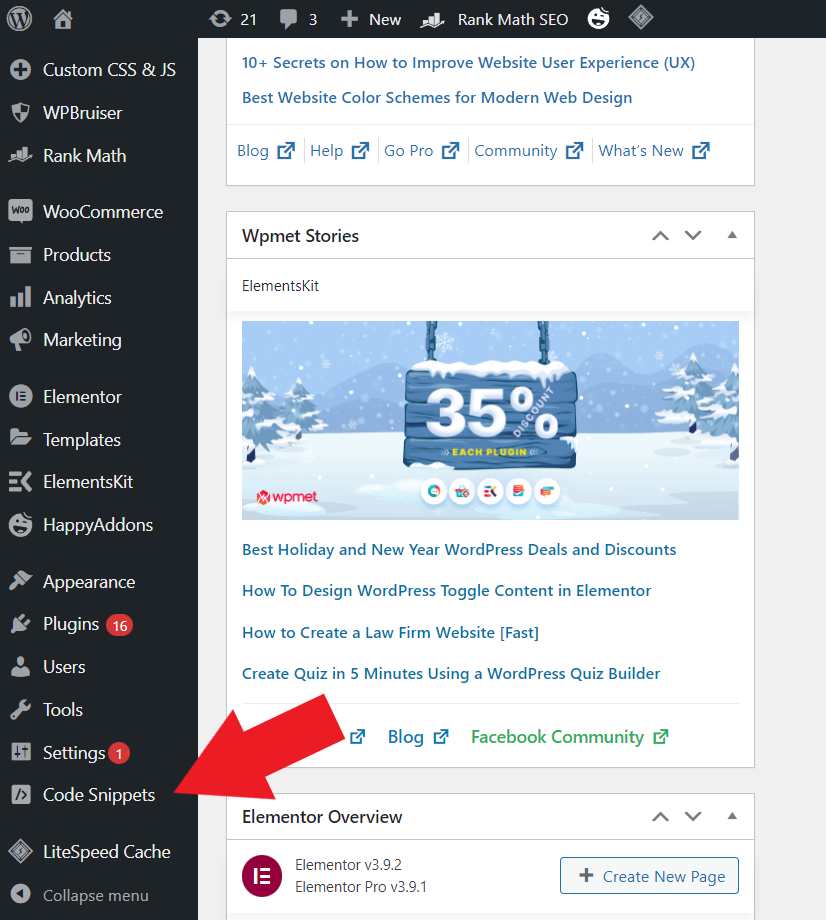
Then, click “Header & Footer”
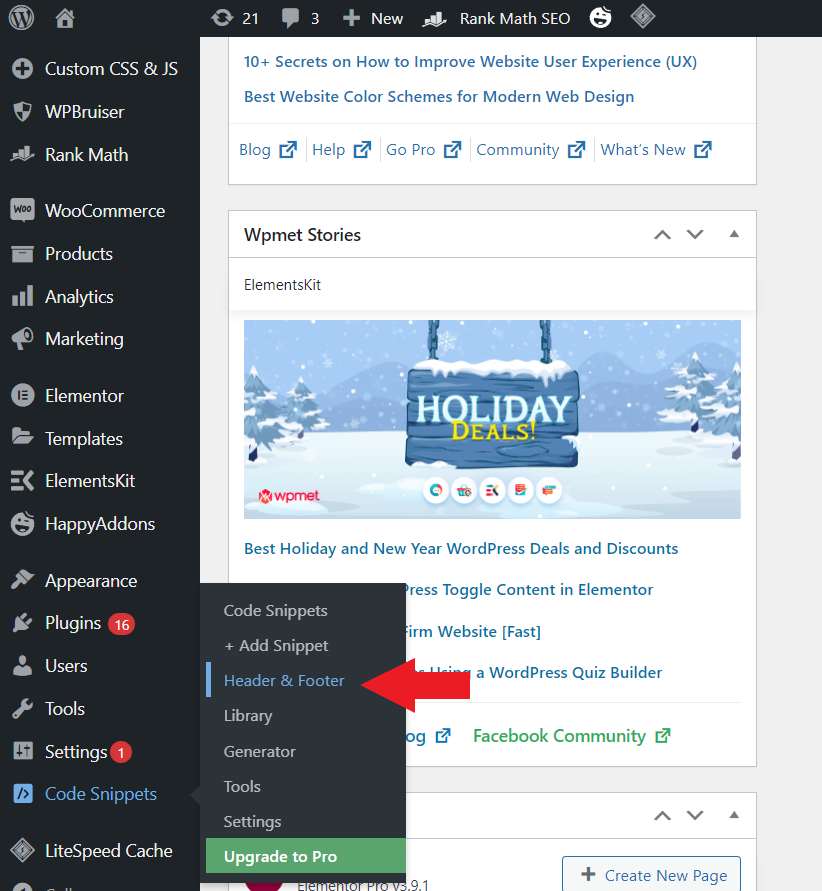
Hover over the header section and paste the Google Tag from Google Analytics.
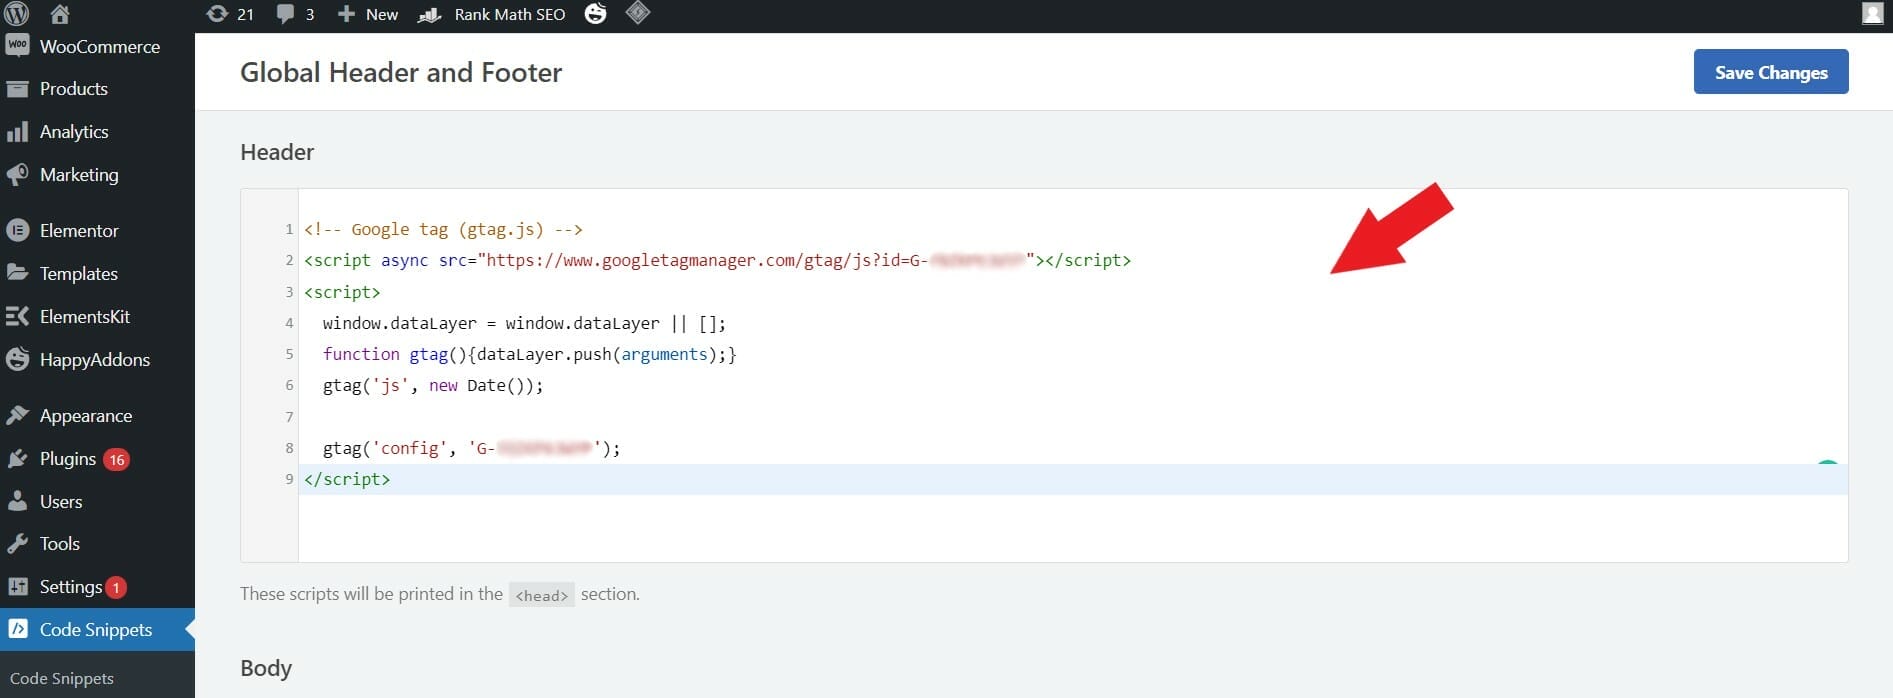
Once done, click “save changes.”
If you’re managing your website on other platforms, you can also install it using your website builder or content management system.
Need help installing Google Tag on your veterinary website?
Important metrics in Google Analytics
After learning the steps on how to create a Google Analytics account for your veterinary website, you have to know which metrics you should be keeping an eye on.
1. Bounce Rate
- Another key metric you can see on Google Analytics is the percentage of page visitors who just viewed a single page on your website and didn’t perform any action before leaving. Here are some of the common reasons why the bounce rate goes up:
- no call-to-action
- poor content
- slow-loading pages
- misleading descriptions or titles
- blank page
2. Top search queries
- The top search queries show you the words or phrases used by your target clients in search engines. Going through the top search queries gives you an idea of what they’re expecting to find on your veterinary website (making your content fit into what they are actually looking for).
3. Users by the time of the day
- You will also have an idea of what specific time of the day or which days most people visit your veterinary website. This metric can be very helpful especially if you’re running Ad campaigns.

4. Traffic Source
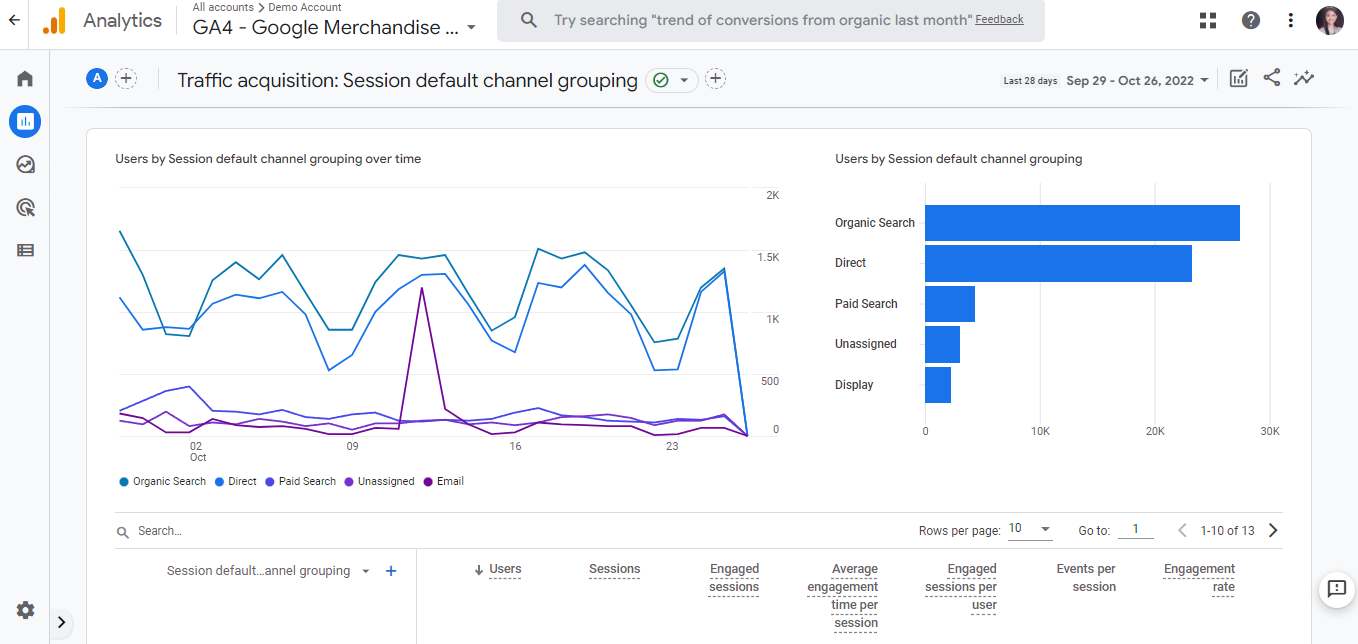
- This metric lets you know where your page visitors came from. It could be from organic traffic, paid searches, referring websites, or direct searches. It’s important to learn where your search volume is coming from because it gives you an idea of what strategies to apply to improve the conversion rate on your veterinary website.

- And here is what it looks like in Google Analytics v4:

4. Realtime Reports
- You can also see real-time reports of what’s happening on your veterinary website. This includes the geographic locations of your active users, which medium and sources are referring your website to these users, specific pages viewed on your veterinary website, and the events your page visitors do on your website.
Here’s an example of a real-time conversion data report on Google Analytics:
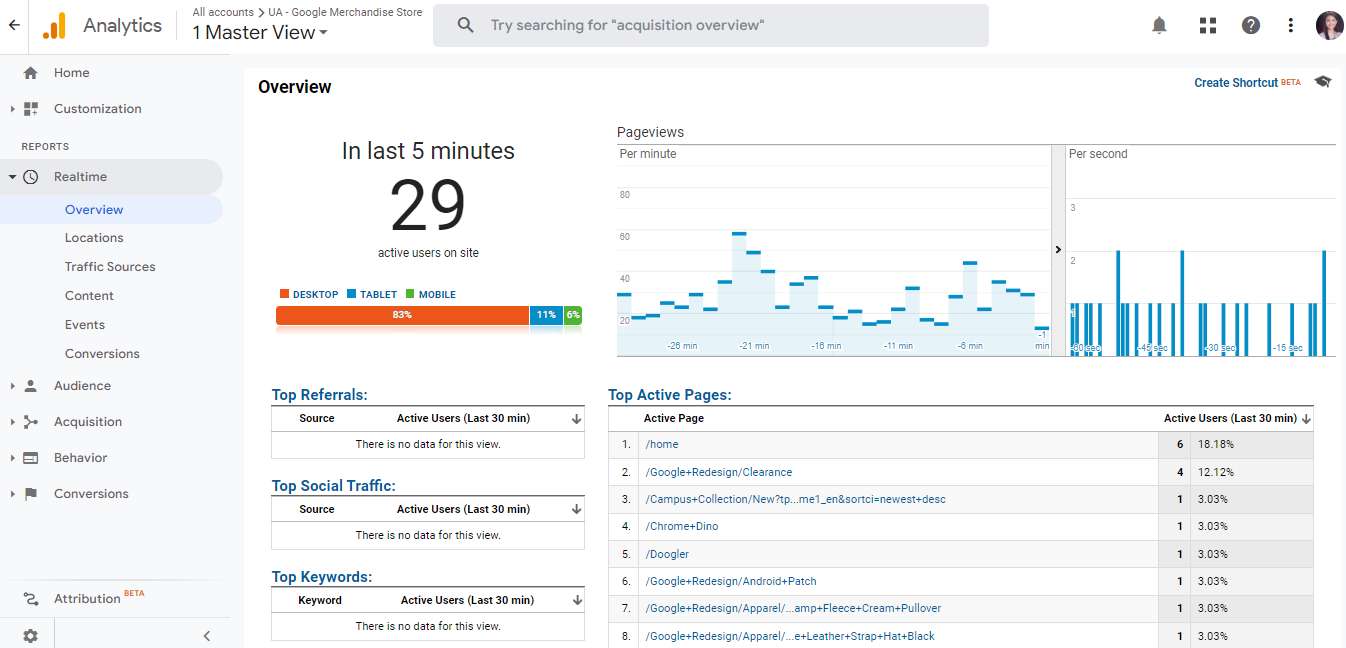
Here is what it looks like in Google Analytics v4:
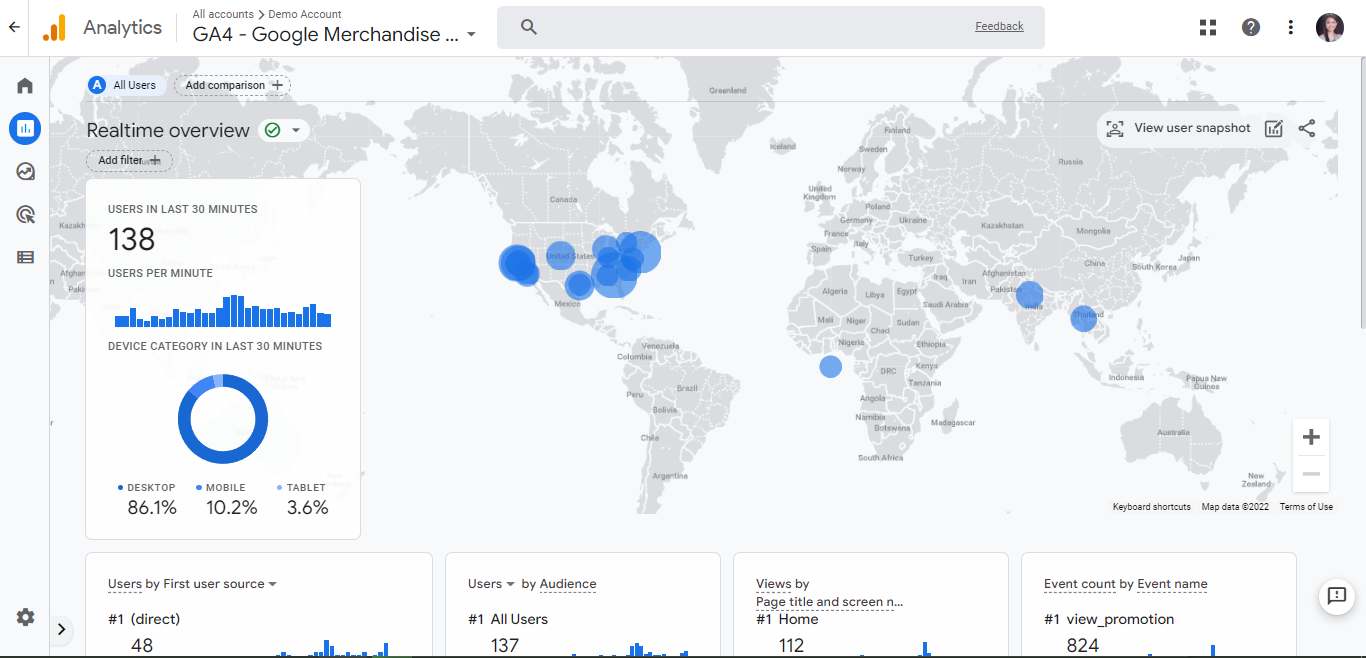
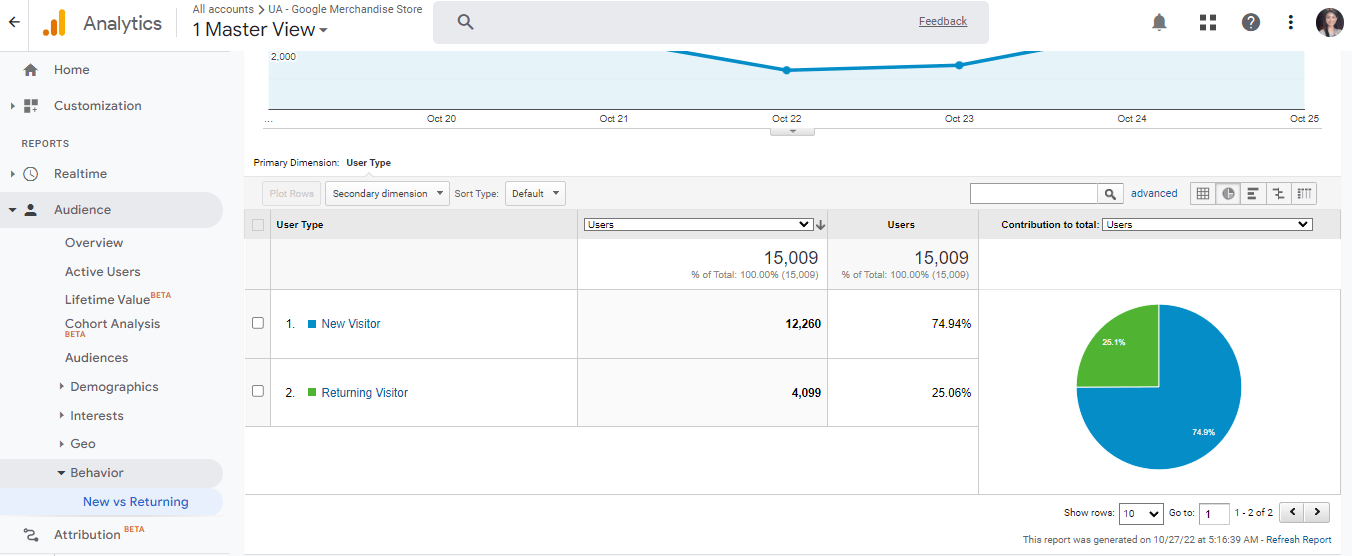
6. Returning visitors
- Returning visitors refers to the individuals who have visited your website before. This is one of the factors that determines how effective your marketing efforts are and how powerful your brand is when it comes to attracting page visitors. Having a high number of returning visitors gives you the impression that users find your content valuable.
Returning visitors on Universal Analytics:
Returning visitors on Google Analytics version 4:

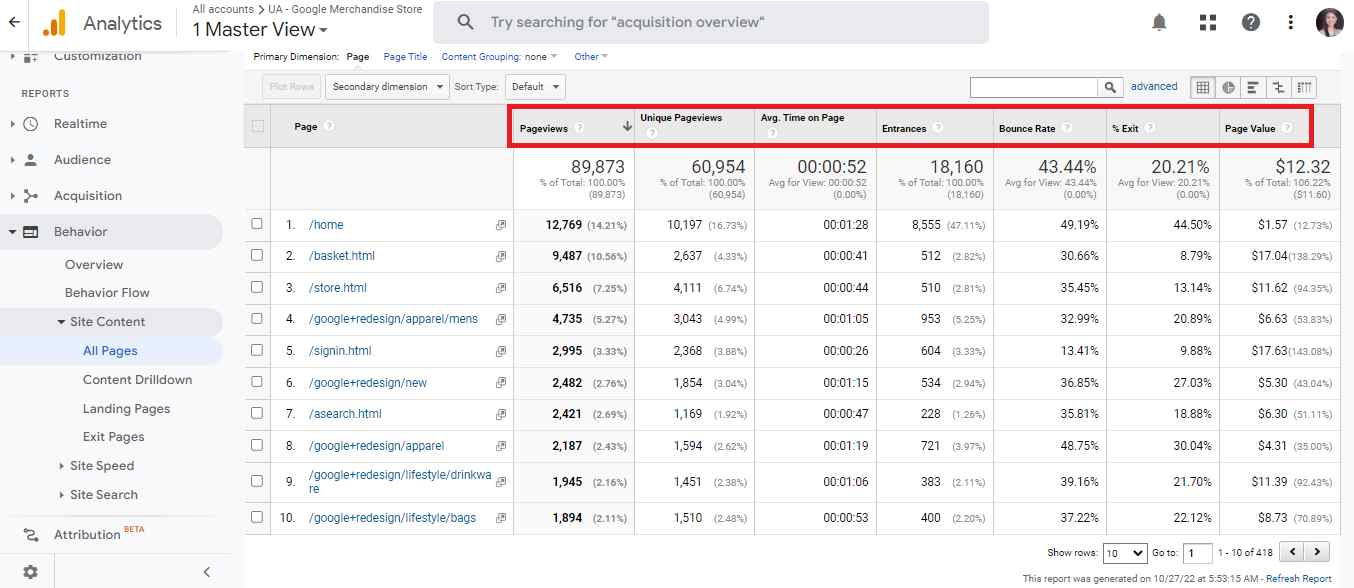
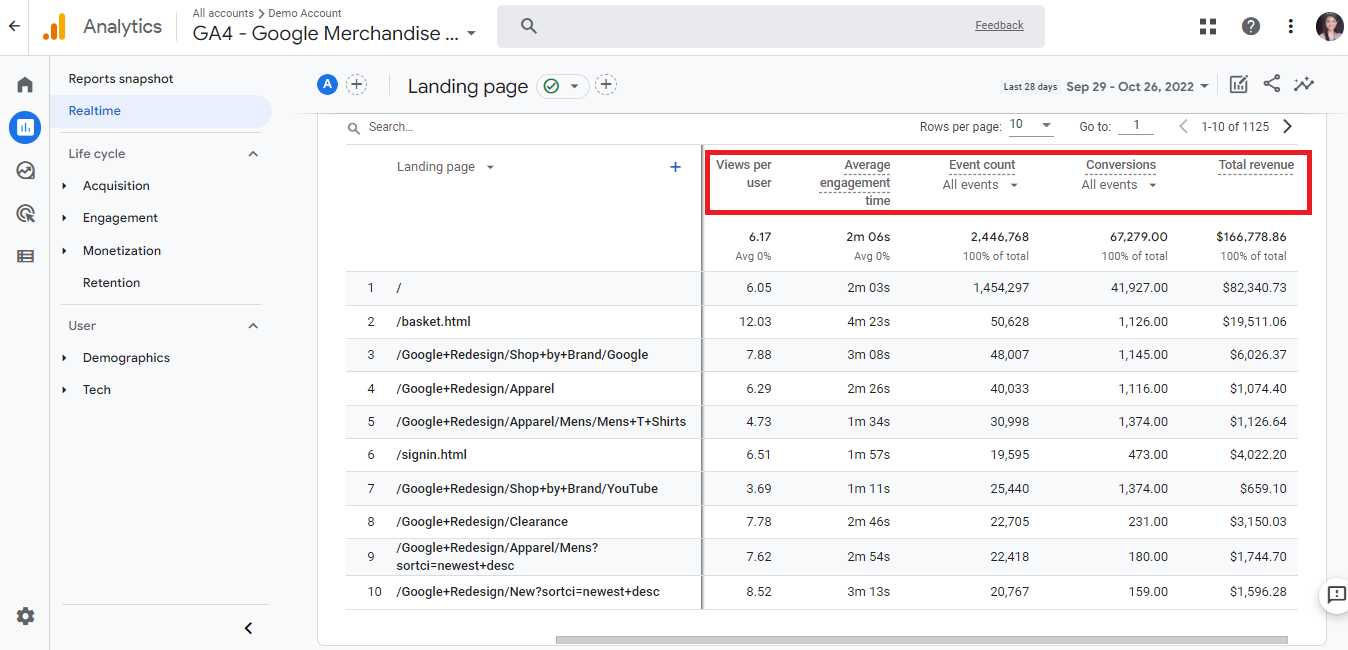
7. Top landing pages
- Top landing pages refer to the pages on your veterinary website that gets the highest traffic. Typically, this is the first page that most people land on when getting to your veterinary website. It’s important to know which page gets the most traffic on your site because it helps you focus on attracting more users to your site.
Landing page performance report on Universal Analytics:
Landing page performance report on Google Analytics version 4:
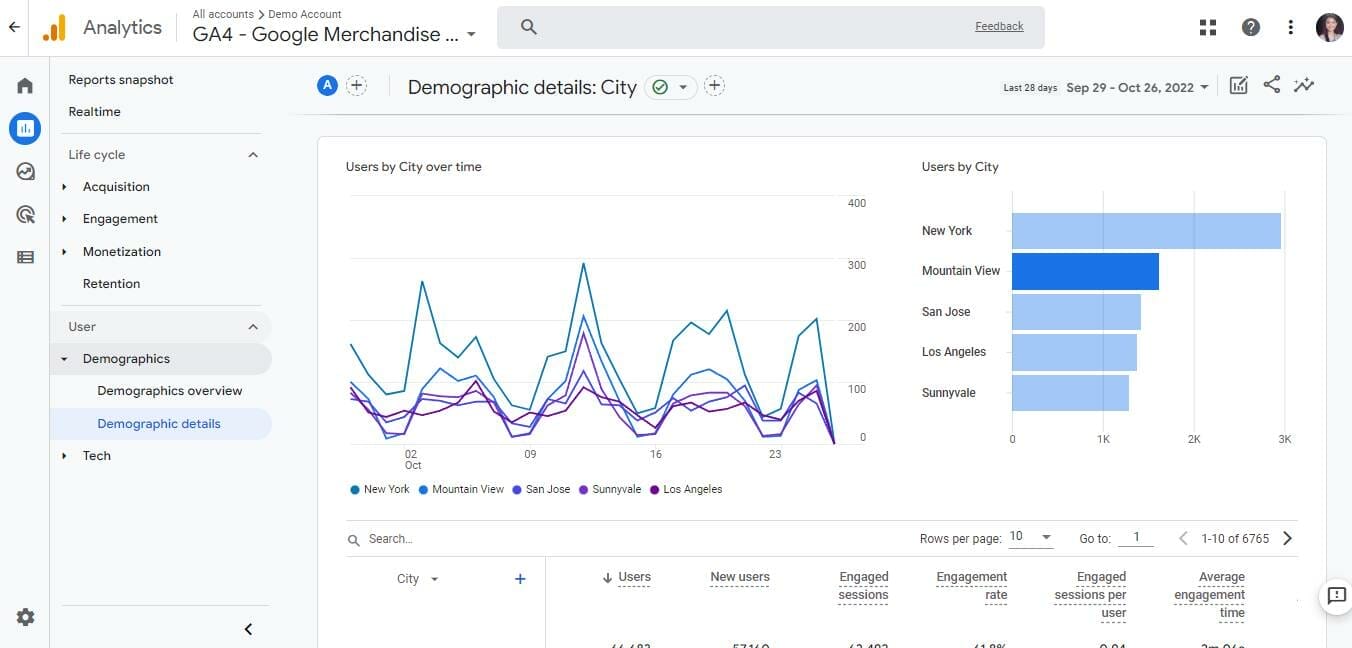
8. Top locations report
- You can also see the top locations of individuals who page visited your veterinary website. You can even set filters to see which countries or cities do most of your page visitors come from.
Locations report on Universal Analytics:

Locations report in Google Analytics version 4:
9. Events report
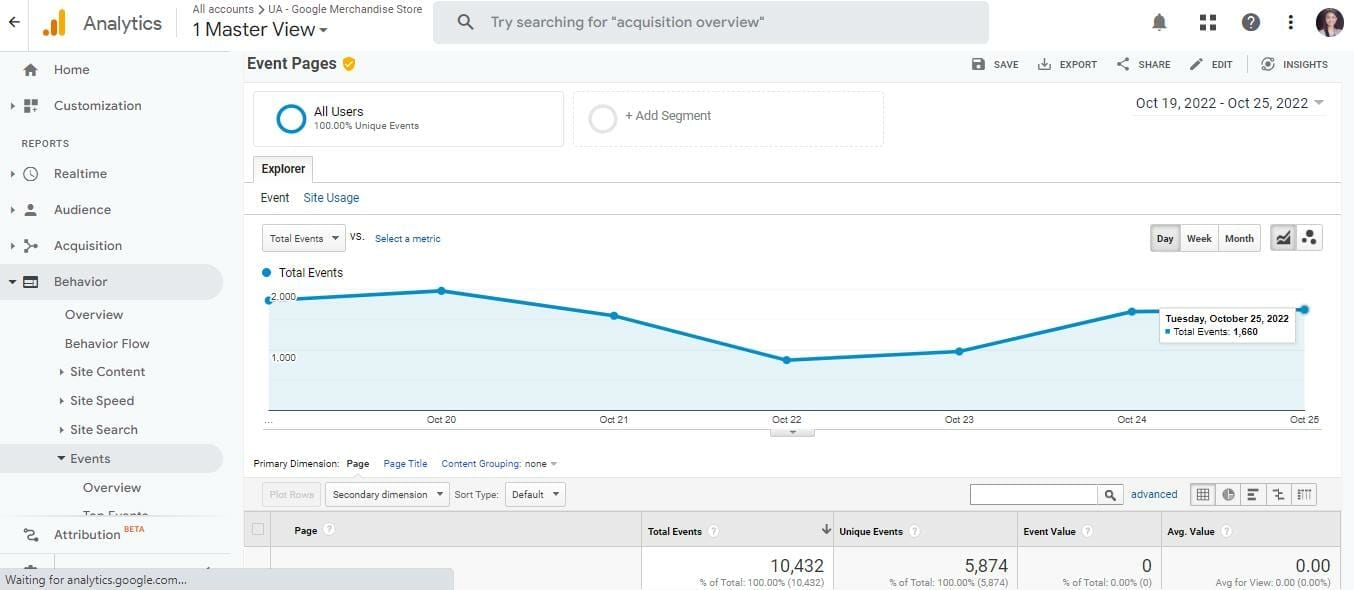
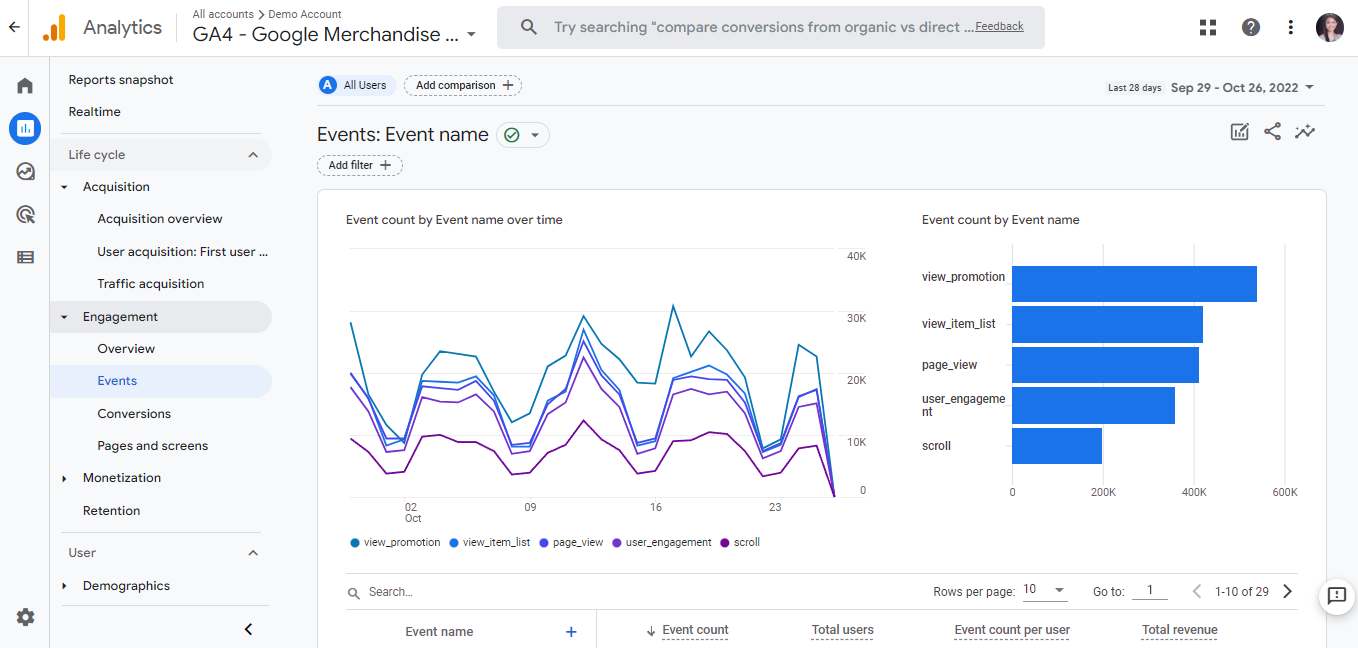
- The events report gives you an overview of the actions performed on your veterinary website such as clicking on your CTAs, watching a video, or scrolling to the bottom of your site. If you are installing a code on your website and want to look if it works, checking the Events report is one way to see if it works or not.
Here’s what the Events report looks like in Universal Analytics:
While this is what it looks like on Google Analytics version 4:
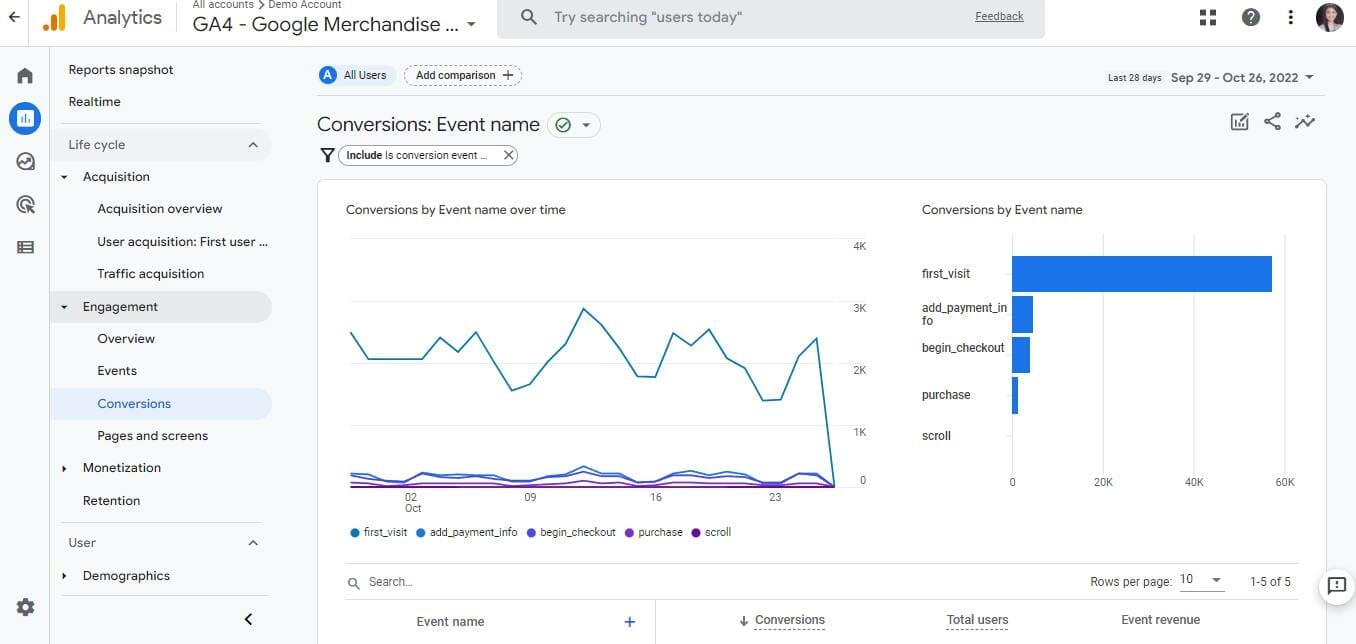
10. Conversion rate
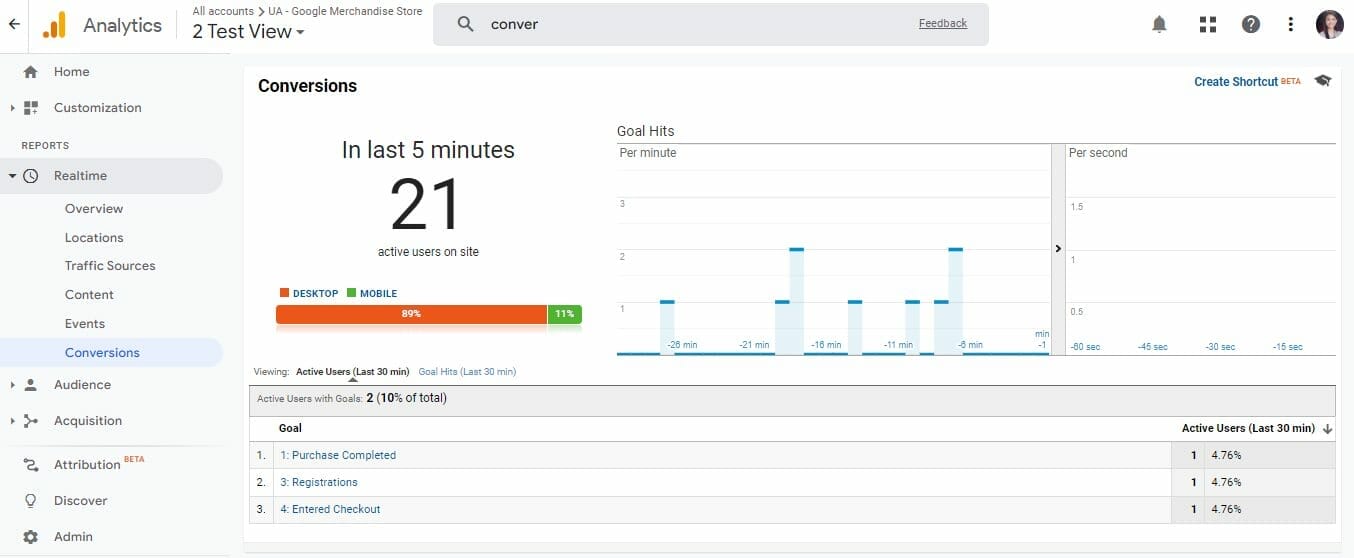
- This refers to the percentage of completed actions on your veterinary website (e.g. submitting a form, calling your veterinary clinic, or placing an order from your veterinary website).
Here’s an example of a conversions report in Universal Analytics:
Here is what it looks like in Google Analytics v4:
Best practices in using Google Analytics for Vets
Creating a Google Analytics account for your veterinary website isn’t enough if you want to get the most out of your marketing campaigns. In this section, we’ll share with you some tips on how to maximize the use of Google Analytics for Veterinarians!
1. Regularly check your Google Analytics
Once you’re done setting up Google Analytics for Veterinarians, make sure to make it a habit to check your veterinary clinic’s website performance at least once a week or conduct an in-depth analysis at least once a month. This will make it easier for you to catch up on possible issues before it gets worse and see if you are meeting your goal.
Note: Monitoring the performance of your veterinary website helps you identify patterns based on user behavior in previous months.
2. Optimize best-performing pages
Once you identify which pages get the most number of views, clicks, and conversions apart from other pages on your veterinary website, don’t forget to optimize them. This way, Google will have a better understanding of what your website is all about and increase your rank on relevant search results.
3. Use Google Analytics Annotations
If you are working with a team in analyzing the performance of your veterinary website, Google Analytics Annotations can come in handy. Here, you can add notes within the charts and reports, which can serve as a reminder whenever there is a drastic change that took place in your website (e.g. increased bounce rate or decreased number of page visitors).
You are also given the option to choose whether you want to share your note with anyone who has access to your veterinary clinic’s Google Analytics or make it private.
Here’s how to add an annotation to your Google Analytics reports:
Step 1: Click the tiny button that can be found under a graph report
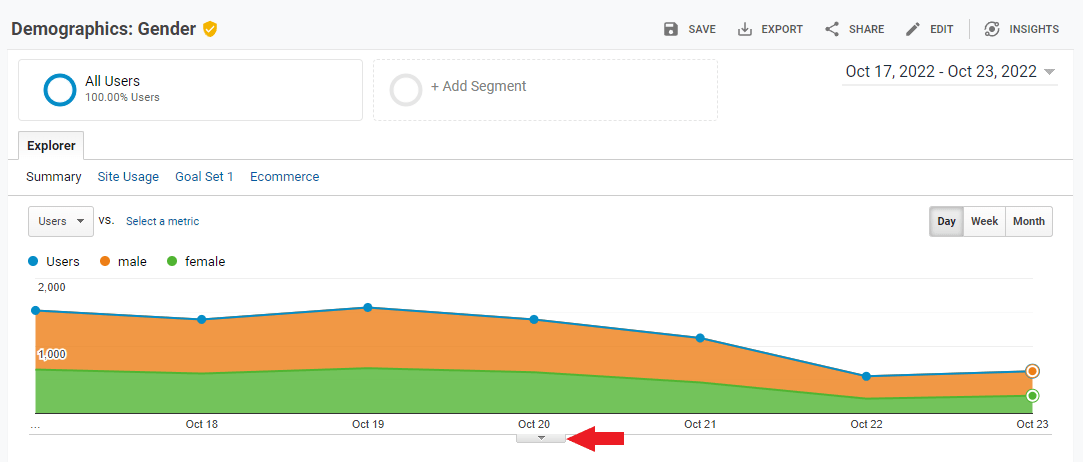
Step 2: Click “+ Create a new annotation”
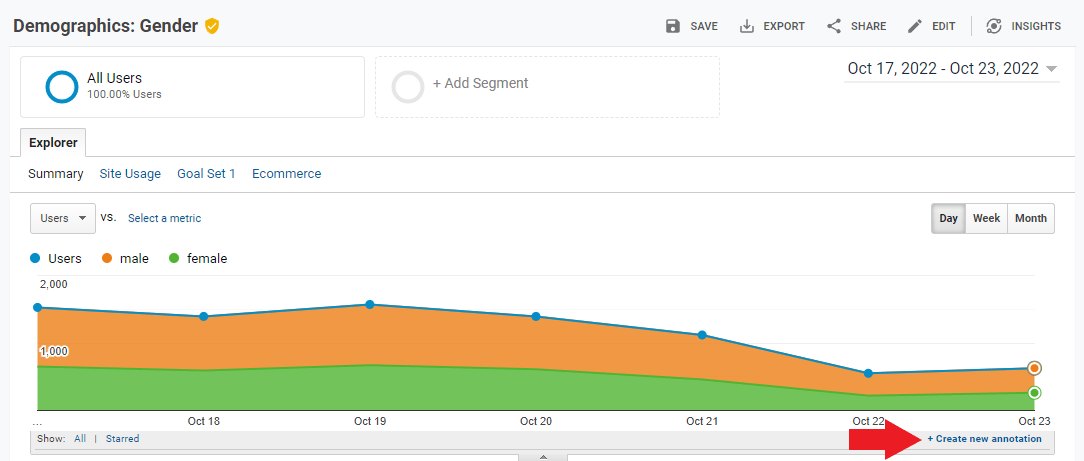
Step 3: Add a brief explanation behind the drastic change in your website’s performance.

Step 4: Once done, choose how you want your note to be visible (e.g. shared or private). Then, click “save.”
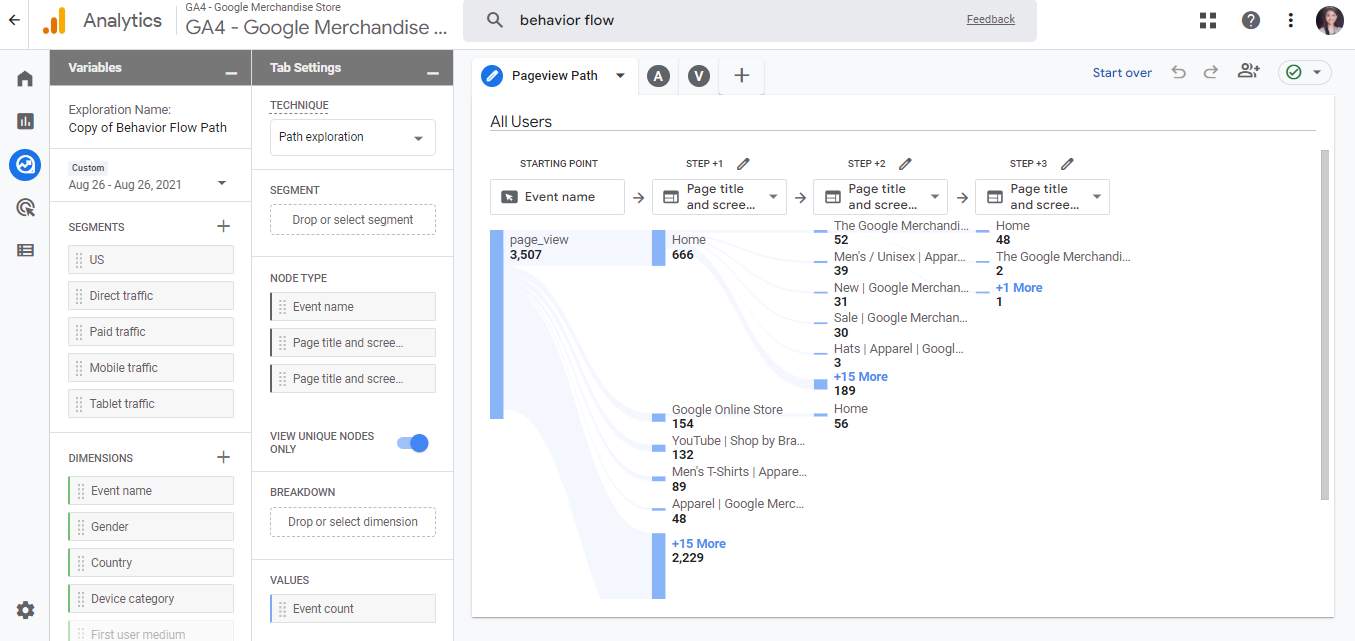
4. Track a user’s journey through behavior flow
The Behavior Flow report helps you visualize what keeps your target audience engaged or what event triggers page visitors to submit their email addresses to your monthly newsletters. It’s important to keep track of your users’ buying journey because it helps you identify possible issues that page visitors encounter while navigating your site.
Behavior flow report in Universal Analytics:

Behavior report on Google Analytics version 4:
5. Check user behavior
Another reason why you should consider using Google Analytics is that you’ll have a better understanding of your page visitors. Google Analytics sets a unique tracking code for each page visitor that allows you to monitor what’s making them stay on your website.
To know what topics capture the interest of your target audience. You can simply go to your Dashboard > Audience > Interests > Overview. From there you’ll see a huge amount of data telling you what your potential clients are more likely to browse.
Here’s an example:
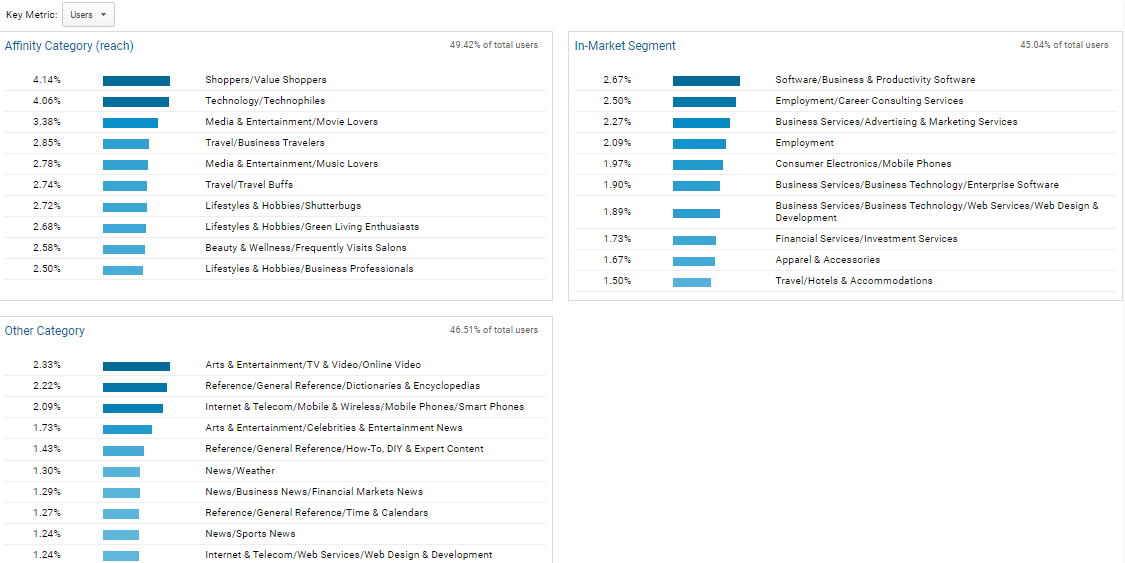
Having a background of your target audience’s buying journey can be very helpful especially if you want to deliver a better browsing experience to your potential clients.
Need more tips analyzing reports on your veterinary website?
Key takeaway
Google Analytics has lots of tools that can help you understand client behavior as well as the performance of your website. Although the volume of data you receive can sometimes be quite overwhelming when done right, you’ll be able to come up with effective strategies and achievable goals for your veterinary practice.

