The results you get from your campaign are not always enough and you need to get more data from Google Ads to make better decisions. In this article, we will teach you how to segment your data to see additional figures and values that you can use for campaign optimization.
Wants to see more data but don’t know where to start?
Table of Contents
ToggleMore Data, Better Decision
One of the reasons why Google Ads is the best digital advertising platform is because of its data reporting. As long as you are using Google Ads in ‘Expert Mode’, you will have access to a lot of data and insights that you can use to determine whether it is successful or not.
How important are data in Google Ads?
All those Google Ads metrics, when analyzed right, will give you insights into whether your ad campaign is performing well based on your goals. Data will also give you an understanding of how your audience is behaving towards your ads.
Most Google Ad experts recommend turning off ‘display networks’ when it comes to search campaigns, this is because ‘display networks’ usually do not convert well based on their testings and experience. But how are they so sure about this that they always recommend it?
It is because they are looking at the data, specifically on conversions, click-through rate, and other metrics that have significantly better results for ‘search networks’.
Google Ads metrics should always be considered when you make decisions and changes within your Google Ads account.
For example, a specific keyword in your ad group is getting a lot of clicks but does not have any conversions at all, now you have to check the data on why it is not converting.
- Maybe it is because of your landing page? Check metrics such as bounce rate, pages/session, and avg. session duration.
- Maybe it has something to do with the intention of your keyword? Does it have the intent to hire your services or buy your products?
- Is the keyword on the right ad group? Maybe the keyword is not really related to what’s written on the ad group.
- Maybe it’s because you are targeting the wrong location? Check your location targeting and settings.
If you want to know which metrics are most important to look at, read this article about understanding search impression share and other competitive metrics.
So how do you get more data from google ads?
There is one way to get more specific data for every setting of your Google Ads, and we do it by ‘segmentation’ or ‘granular targeting’. This is done by creating small segments of data from a broad data that you get from Google Ads.
For example, you set your location target by state – California.
That is a broad location and you wouldn’t know which cities are performing the best for your ads. So in order to get more location data from this, we could segment California into cities, counties, and zip codes. This way, you would know which parts of California your ads are getting the most traffic, conversion, and so on. Then you could make changes from these segmented data.
Get More Data From Google Ads By Segmentation
Ad Schedule
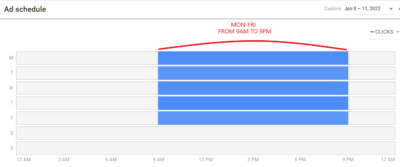
In this example, this campaign has an ad schedule of their peak hours which is from Monday to Friday, 9 AM to 9 PM.
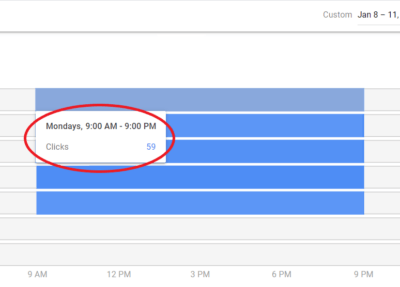
And if we hover on the table, you will see here that we got 59 clicks on a Monday, 9 AM-9 PM, from January 8 to 9, 2022. So now you have an idea how many clicks you can get from 9 AM to 9 PM, but you only have broad data.
To get more data, you can segment each schedule into smaller ranges of hours. Go to the ad schedule settings on the left vertical menu, then click the edit icon on the upper left side.

Now, you can choose how you want to segment your schedule. It can be every 2, 3, 4 hours, or any way you want to get your data. Just make sure that each schedule you set is not overlapping with each other. Once you are done, click ‘Save’.
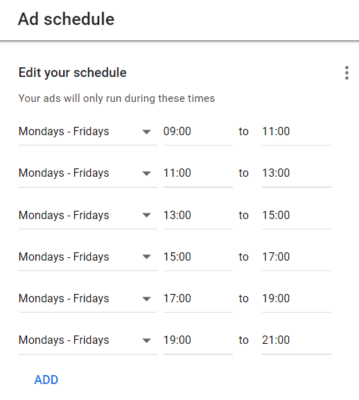
Now your schedule will look like this:
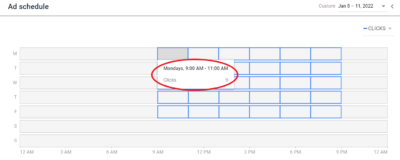
You can now see which hours get the most clicks within the day. Then, you have the option to bid higher on those hours that your ad is getting the most click or decrease bids on dull hours of the day.
Just go to the ad schedule below and click the edit icon under ‘Bid adj.’ column. Set if decrease or increase, then input the value in percentage.
In this example, the schedule Monday 1 PM – 3 PM is not getting enough impressions and clicks. We decreased the bidding on this schedule and increased biddings on Mondays from 5 PM to 7 PM. This will push the budget more on the most productive hours and less on the dull hours.
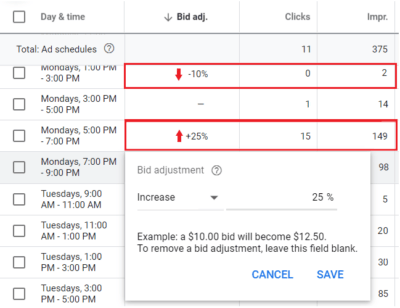
This is what the table will look like once you have set your bidding adjustments.
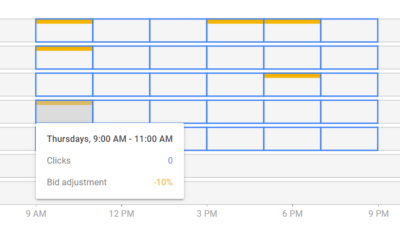
Always keep in mind that before you make changes or adjustments in the bidding, make sure that you have at least months of available data that can back up your decisions.
Not sure when to adjust the bidding?
Location
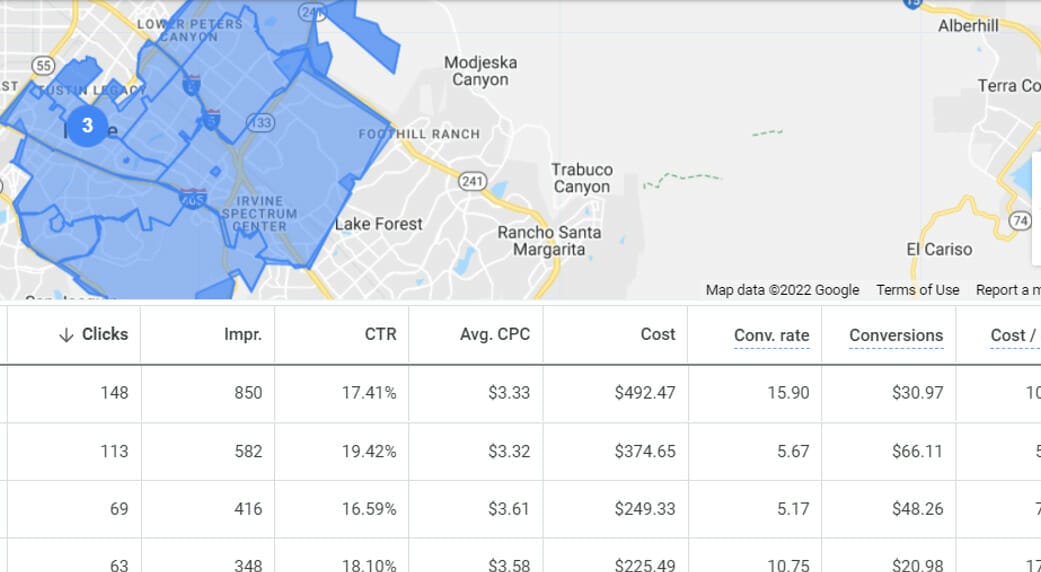
In this example, the campaign is targeting Irvine, which is a city in California, United States. Here, we can see that the campaign is 148 clicks and 850 impressions from this. But in order to see more data from this, we could segment the target city into zip codes. To segment this, click on the edit icon on the left side.
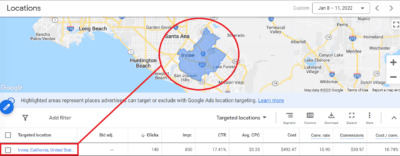
Then, turn on the toggle button and choose ‘Show by postal code’.
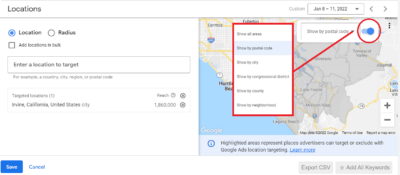
You can now click on each zip code area and click ‘target’ to add the zip codes on the target location list. If you already have your list, you can also just type in zip codes on the text box ‘Enter a location to target’. Once you’re done, click ‘Save’.

Now you will see data on specific zip codes. Your table and map should look like this:
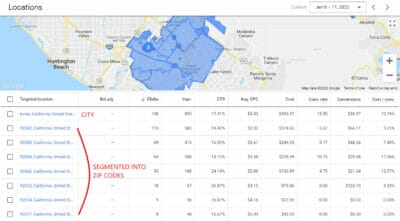
If you have enough data to make conclusions and adjustments, you could adjust your biddings on the zip code that has a better engagement. Here, we increase the bidding for 92602 because it has the highest engagement, and then we decreased the bidding for 92617 since it is not performing well.
These bidding adjustment will push our ads more in the 92602 and less in 92717.
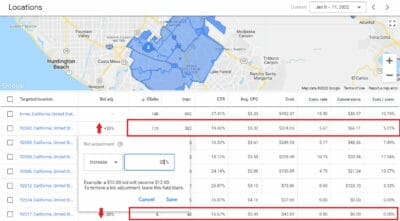
You could also do this by radius if you are targeting by miles or kilometers.
Audiences
To understand the behavior, hobbies, demographics, and interests of your general audience or potential customers, you can get data by segmenting your audience into categories and sub-categories.
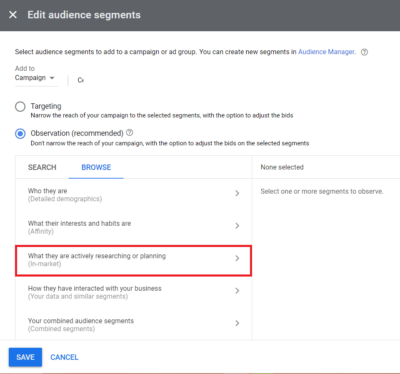
Just go to the audience settings on the left vertical menu, click ‘Show table’, and then select ‘Edit audience segments’.
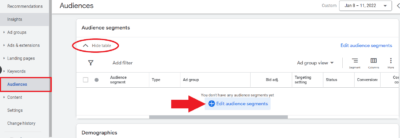
Now make sure that this audience segment will be added to the campaign level. Click on ‘Browse’ and select ‘In-market’.
You also have the option to segment it by demographics (parental and marital status, education, homeownership status, employment), affinity (interest and habits), your existing customers, and combined segment. But for this example, we will be focusing on ‘In-market’, these are the topics that your potential customers are actively searching.
You can read more about audiences in this article on how to use audiences in Google Ads.
This campaign offers financial services, we will select all categories and sub-categories under financial services.
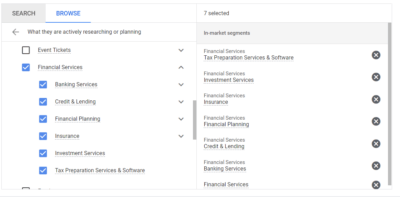
Click on the dropdown arrow to see more sub-categories and add them to the list.

This is what your table would look like and you can see here the performance of each category. You will have to scroll down to see all the categories and sub-categories since it is a lot.
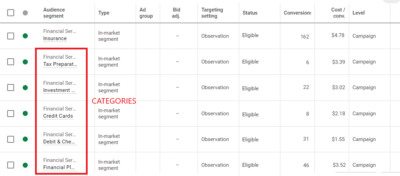
Again, you can bid on each category and base it on the data available. If a specific category is performing well, you can increase its bidding so that your ad will show up more to those audiences that are currently searching in that chosen category.
Don’t have the time to segment all your data?
Segmenting Will Boost Your PPC Management
Segmenting technique will surely change the way you understand your potential customers and it is really important to always base on results before you make changes on your Google Ads account.
If you want comprehensive management and optimization of your Google Ads account, you can schedule an appointment and talk to our PPC experts!

