If you’re running a Google Ads Performance Max Campaign, then this guide is for you.
In this guide, we’ll walk you through the essential metrics you should be monitoring when analyzing a Google Ads Performance Max Campaign. From campaign assets to placement reports, we’ll provide insights into each metric’s significance and how it contributes to the overall success of your campaign.
Google has rolled out a wave of transparency and control updates for Performance Max in 2025 and 2026, including channel-level reporting, full search terms reporting, expanded asset metrics, campaign-level negative keywords (up to 10,000 per campaign), and up to 50 search themes per asset group. We’ve added these new reports below so you can use them in your own optimization workflow.
Want to improve your Google Ads Performance Max campaign?
Analyze Your Google Ads Performance Max Campaign Using These Metrics
Asset Group Performance
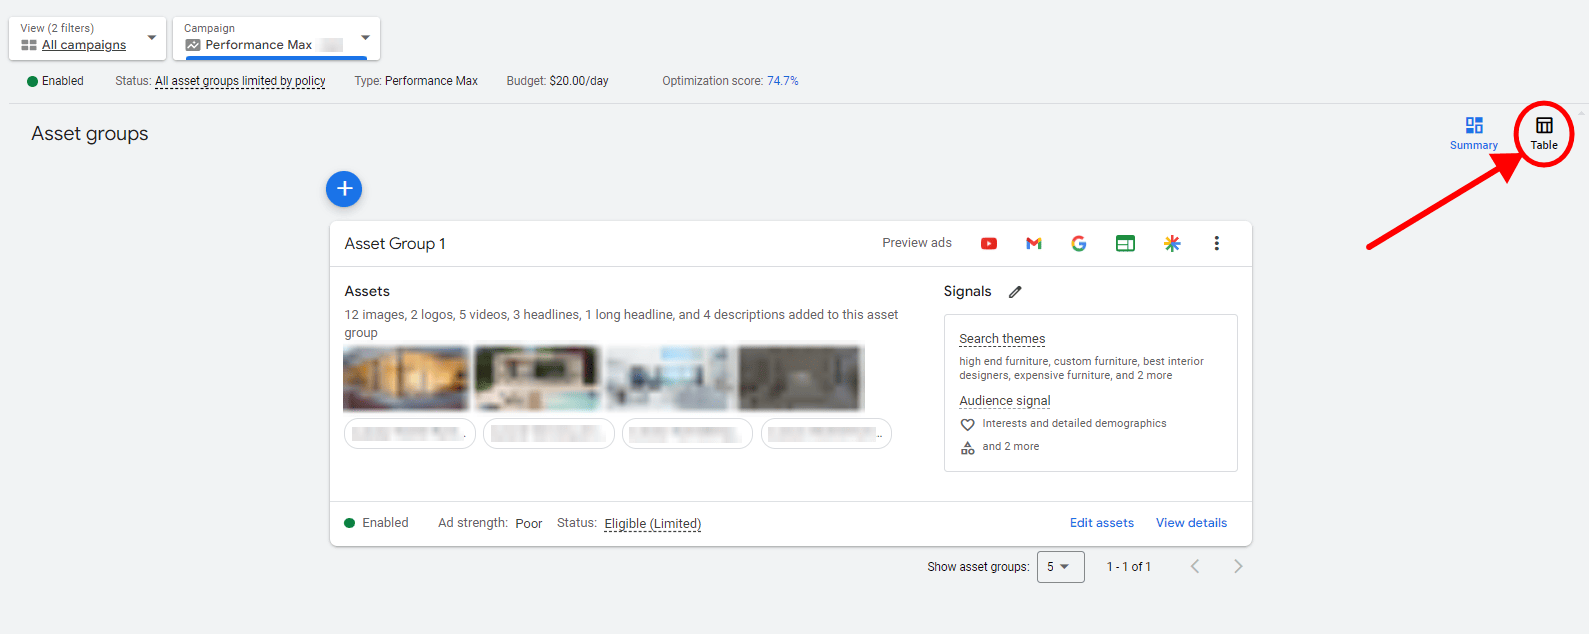
This is one of the most important metrics or reports that you should be looking at in a Google Ads Performance Max campaign. This shows you how your assets are performing inside of the pMax campaign.
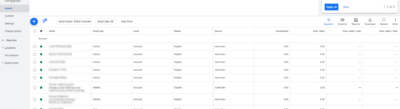
To find this report, go to your Performance Max campaign, and “Asset Group” should be on the left vertical menu. To fully view this report, switch from summary view to table view:
Then click on the columns to add performance metrics such as impressions, clicks, CTR, avg. CPC, cost, conversion, cost/conv., and conversion value. This allows you to compare numbers and analyze your asset group performance better.

Your table should look like this:
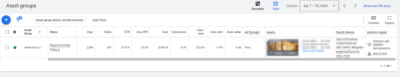
It looks at the performance of different asset groups. You can see how the budget is spread between them, you’ll see the difference in ROAS, CTR, and CPC. Maybe your other asset group is doing better compared to your other asset groups.
This report will help you to evaluate your asset group structure. It allows you to dig a little deeper, and you can test alternative approaches.
Channel Performance Report (New)
This is one of the biggest reporting upgrades Google has shipped for Performance Max. Channel performance reporting shows you how your campaign is performing across each individual channel inside pMax: Search, Shopping, YouTube, Display, Gmail, Discover, and Maps. For years, pMax was a “black box” where you could not see which channels were eating your budget, and this report finally gives you that visibility.
To view it, go to your Performance Max campaign, click “Insights and reports”, then look for the channel performance section. You can see metrics like impressions, clicks, cost, conversions, and conversion value broken down per channel.
Use this report to figure out which channels are actually driving your results. For example, if YouTube is burning a chunk of your budget but driving very few conversions, you can adjust your asset mix (text and image only vs. full creative including video) or restructure your campaign to limit that channel’s share. If Search and Shopping are doing the heavy lifting, you’ll want to double down on product feed quality and search themes.
Search Terms Report (New)
Performance Max now has a real search terms report, not just the vague “search categories” insights from before. To find it, go to your Performance Max campaign, click “Insights and reports”, and then “Search terms”.
This report shows you the actual search queries that triggered your Search and Shopping placements. Use it to:
- Identify wasted spend on irrelevant queries (jobs, free, DIY, near me for online-only businesses, etc.)
- Spot new negative keyword candidates
- Confirm whether your search themes are actually pulling in the right traffic
- Check for overlap with your branded Search campaigns
Review this report at least once a month, more often if you have a large budget. Queries with high cost and zero conversions are your highest-priority negative keyword candidates.
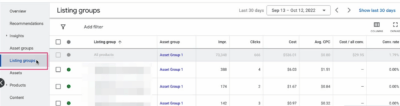
Listing Groups
It allows you to look at the share of shopping and dynamic remarketing inside your Google Ads Performance Max campaign.
To view listing groups, just go to your Performance Max campaign and you should see “Listing Groups” on your left vertical menu.
For example, it compares the total cost of your campaign versus the total cost inside of a specific listing group and you can compare the two. What portion of my budget is being spent on shopping vs all the others?
Performance Max hides a lot of data but at least listing groups can show you a little bit how your budget is being spent.
The listing groups also show you how the product behaves inside of the asset group. It might not seem like a huge insight to work on but there’s actually no other way for you to find out how a product is performing inside of an asset group.
To do this, you can add specific products to each asset group and compare them, then you can compare each asset group and pause poor-performing products or asset groups.
Assets
To view assets, just go to your Performance Max campaign and you should see “Assets” on your left vertical menu. You don’t see any conversion metrics like in the table below, you can just add it through the columns icon.
Asset reporting has been significantly expanded. You can now pull impressions, clicks, cost, average CPC, conversions, and conversion value at the individual asset level (not just the Low / Good / Best performance label). This gives you actual data to decide which headlines, descriptions, images, and videos are pulling their weight.
To analyze the assets report, look at each asset at the account level and campaign level. Monitor for low performance and replace them if needed. Prioritize those assets with consistently higher CTR.
Products
To view your products report, just go to your Performance Max campaign and you should see “Products” on your left vertical menu.
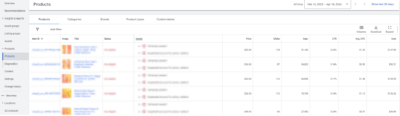
You can use it to see which products get the most visibility, you can look at CTR, and ROAS, and see which products are not performing well.
Look at your product report on the account level, and on the campaign level. Check how each product behaves inside the Google Ads Performance Max campaign.
For example, if your entire account has decreasing sales, you can look at the product table here to see which products have a drop in performance. Spot the outliers in terms of CTR, ROAS, conversion rate, etc.
Asset Details
To view your asset details, just go to your asset groups, and on the summary view, click on the “view details” below.

This report is available to a specific asset group. The performance labels (Low, Good, Best) are still vague, but they’re now paired with the expanded asset metrics mentioned above (impressions, clicks, cost), so you can cross-reference label against actual numbers. Change the assets that are performing low, and test out other assets by checking their performance here.
A practical rule: give a new asset 4 to 6 weeks of data before replacing it, and replace Low-rated assets in batches rather than one at a time so you can see directional impact.
Want to get better results from Performance Max campaign?
Asset Combinations
To view your asset details, just go to your asset groups, and on the summary view, click on the “view details” below. Now switch to the “Combinations” tab.

Shows you how your assets are being combined and shown on Google search results. They are sorted based on how many impressions they get.
This gives you an idea of how your ads look, and you can decide if the entire ad combination looks good to you. Is this what you want to show up on Google search results?
Landing Pages Report
To view your landing page report, go to All Campaigns view on Google Ads, and on the left vertical menu, click “Insights & Report”, then go to “Landing Pages”. You can’t see this inside your Google Ads Performance Max campaign, so you have to look at it in “All Campaigns” view.

You can use it to kinda deconstruct your Performance Max campaign. This gives you an idea of how often your final URL shows up, how often your individual product page URL shows up, and so on.
This gives you insight into the impact of final URL expansion or page feeds.
Video Views Report
To view this report, go to “All Campaigns” view, and add “Avg. CPV” and “Views” (found under the Performance tab) columns to the table.

Video views report shows you if your video assets on your Performance Max campaign are getting any video views and how many you are getting. If you don’t have an optimized video asset in your Google Ads Performance Max campaign, then don’t expect to get good results from your video assets.
You can see the impact of your video assets. It can be the video that you added, or it can be the automated video that Google added. If you don’t want Google to create a video for you, make sure to upload an optimized video to make sure that your pMax campaign will perform well.
If you want to calculate your video spend, just multiply the number of views by the cost per view (CPV).
Google has also rolled out an “Ads Using Video” segment in pMax reporting that lets you directly compare performance between ads that included video and ads that didn’t. If your video assets are pulling in conversions, that’s your signal to invest in producing more video.
Auction Insights
To view the auction insights report, go to your Google Ads Performance Max campaign, click on “Insights & reports” and then “Auction insights”. There are two available auction insights reports here, one for search, and one for shopping.
This allows you to compare your shopping ads vs search ads.

You can also see your auction insights under “Insights”. Just make sure that you are on your Performance Max campaign view. This gives you the same information, but this helps you visualize the auction insight report.

There’s 3 metrics that are present in your auction insights:
- General auction insights:
- Impression share: your impression share vs competitors for the same impressions
- Overlap rate: impression together with other advertisers
- Outranking share: from those impressions, how many did you win
- Auction insights for search ads only:
- Position above
- Top of page
- Abs. Top of page
You can also segment these data by device and time if you want to check it.
Auction insights will help you see competitors and monitor changes between your competitors. It’s hard to take action based on these data but it’s good data to look at. To read more about auction insights, you can read it here.
Search Themes and Negative Keywords (New Controls)
Two control levers are worth a quick mention because they directly affect almost every report above.
Search themes: You can now add up to 50 search themes per asset group (up from 25). Search themes tell Google which kinds of queries you actually want to compete on. Think of them as a steering wheel for the algorithm. To find them, go to your asset group and look for “Search themes” inside the audience signal section.
Campaign-level negative keywords: Performance Max now supports up to 10,000 negative keywords per campaign, added directly inside the Google Ads interface (no more support tickets). To add them, open your Performance Max campaign, click “Audiences, keywords and content” on the left, then go to the “Keywords” tab. Negative keywords apply to Search and Shopping placements only, not YouTube, Display, Gmail, or Discover.
Used together, search themes (to pull in good queries) and negative keywords (to push out bad ones) are the closest thing pMax has to traditional keyword control.
Customer Acquisition Cost Reporting
If you care about new customers vs. repeat customers (most businesses should), Performance Max now exposes a customer acquisition cost column in campaign reporting. You’ll also see retention goal data if you’ve enabled bidding for lapsed customers. This makes it easier to tell whether your pMax budget is actually growing the business or just paying to reconvert your existing audience.
Still don’t know where to start?
Conclusion
By monitoring metrics such as asset groups, channel performance, search terms, listing groups, and the others mentioned above, you can get valuable insights into Google Ads Performance Max campaign performance. Once you analyze these metrics, you can plan your strategies, allocate your budget more effectively, and drive good results for your businesses.
Performance Max in 2026 is no longer the “set it and monitor it loosely” campaign type it was a couple of years ago. Google has handed advertisers a lot more visibility (channel reports, search terms, asset-level metrics) and a lot more control (campaign-level negative keywords, 50 search themes per asset group). That means more upside if you actively manage it, and more wasted spend if you don’t. If you need more help with Google Ads Performance Max campaigns, you can set up a free consultation with our experts today!

