Here’s an example of one of our a/b test case study: How This Button Change Increased Our Client’s Revenue by 28%
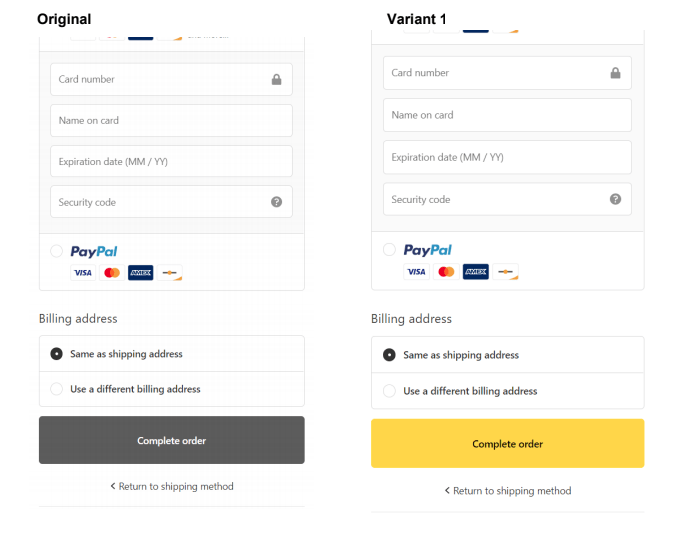
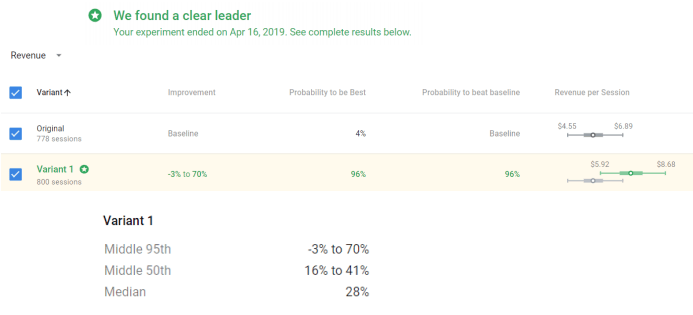
- As you can see, we use the median.
You often see case studies from ad agencies talking about how they increased conversion by _%.
They are always using the highest number on the distribution curve. Which would be 41% in this case [highest value on the Middle 50th of the distribution curve].
Some might even use the 70% number [highest value on the Middle 95th].
They do that to “pump up their case study” to make it look good. You don’t ever see them using the lowest number on the distribution curve haha. Using the highest number to pump up the case study is incredibly misleading because realistically the actual _% increase is likely closer to the median.
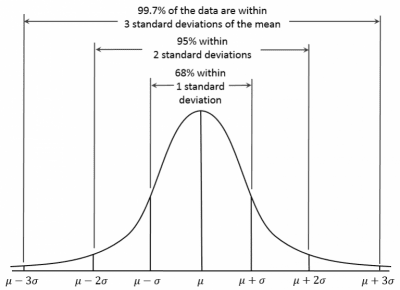
That’s just simple stats: the further away you get from the mean of the curve, the more unlikely the scores become.
If you see any a/b test case study that doesn’t show you the median/mean, that means they are talking about the highest number on the distribution curve.
Side note: in most cases in stats median is even better (because it’s resistant to outliers). That’s why the a/b testing tool shows the median.
At YoYoFuMedia, we are committed to honesty and integrity, which is why we always use the median in our case studies.






1 thought on “Why we always use the “median” and our fight against exaggerated stats.”